
Migrants in Modern Belgium
Flows and Mortality.
By Marina Vergeles
Belgium has long been a crossroads of migration. From Italian and Moroccan workers after the Second World War to today’s European professionals, refugees, and newcomers from across the globe, migration continues to shape the country’s population.
But who are the migrants moving to Belgium? Where do they settle, how healthy are they, and do they live longer than native Belgians?
This article explores how decades of migration have transformed Belgium, not only socially and culturally, but also in terms of health and longevity. Behind the numbers are individual journeys that reveal how migration continues to influence life in Belgium today.
Who Is a Migrant?
The term “migrant” has no single universal definition. The International Organization for Migration defines migrants broadly as people who move away from their usual place of residence, whether within a country or across borders, regardless of legal status or reason for moving. This means that expats, refugees, and other internationally mobile groups all fall under the wider category of migrants.
The definition used matters because it shapes both population estimates and the understanding of migrants’ health and social experiences. On 1 January 2022, 17.7% of Belgium’s residents were born abroad, while 12.6% held a foreign nationality. This article focuses on first-generation migrants: people born outside Belgium who now live there permanently.
These definitions overlap: 59% of those born outside Belgium are also foreign citizens. The rest were born abroad to Belgian parents or became Belgian after arrival.
In this article, the focus is on those who have moved themselves – and we define migrants as people born outside Belgium who now live here permanently.
Migrant Definitions in Health Research
In health research, migrants are commonly identified through three variables:
- Country of birth: This clearly identifies people who migrated and does not change over time.
- Citizenship: This captures the children of migrants in countries like Belgium, where citizenship is not automatically granted by birthplace.
- Parents’ country of birth: This also identifies the “second generation,” people born in Belgium with a migration background.
This is the approach used by Statbel, the Belgian statistical office. Under this definition, about one‑third of Belgium’s population is either a migrant or has migrant ancestry.
Who Moves to Belgium?
Figure?
Source:
To describe migration information on flows and stocks is used.
- Migration flows are the new migrants coming to the country in a given year.
- Migrant stock is all migrants that live in the country at this moment.
We can compare these two migration characteristics to other demographic processes: the flows are the new babies born for example in 2026, while stocks are the full population of Belgium the same year. In today’s migrant stock we still see people who have moved in the past.
Before 1880
Belgium Country of Emigration
Before 1880, Belgium was mainly a country of emigration: more people left than arrived, and migration flows remained relatively small.
1880 Onwards
Immigration exceeds emigration
That balance began to shift around 1880, when immigration exceeded emigration. Early arrivals came mostly from neighbouring countries.
After 1918
Migration from Italy, Poland, Hungary, Czechosolvakia, Yogslavia, Algeria and Morocco
These came to Belgium mostly to work in the industrial regions.
Interwar Years
Jewish migrants and others fleeing totalitarian regimes
Some settled permanently in Belgium, while others continued on to destinations such as the United States.
Post Second World War
Labor migration from Italy, Spain, Greece, Morocco, Türkiye, Tunisia, Algeria and Yugoslavia
Belgium faced acute labour shortages and signed bilateral recruitment agreements with these countries. Most recruits worked in heavy industry in Liège and Hainaut or in the coal mines of Limburg.
1960's
Further diversification of the migrant worksforce
By the 1960s, the migrant workforce began to diversify both in occupation and in place of residence, with more migrants entering construction and the service sector.
Or like this -->

Before 1880, Belgium was mainly a country of emigration: more people left than arrived, and migration flows remained relatively small. That balance began to shift around 1880, when immigration exceeded emigration.
Early arrivals came mostly from neighbouring countries, but after 1918 immigration grew rapidly and became more diverse. People from Italy, Poland, Hungary, Czechoslovakia, Yugoslavia, Algeria, and Morocco moved to Belgium, largely to work in the industrial regions.
The interwar years also brought significant waves of Jewish migrants and others fleeing totalitarian regimes in Europe. Some settled permanently in Belgium, while others continued on to destinations such as the United States.
Following the Second World War, Belgium faced acute labour shortages and signed bilateral recruitment agreements with Italy, Spain, Greece, Morocco, Türkiye, Tunisia, Algeria, and Yugoslavia. Most recruits worked in heavy industry in Liège and Hainaut or in the coal mines of Limburg, turning these regions into Belgium’s first “multicultural societies” (Lesthaeghe, 2000, p. 3).
By the 1960s, the migrant workforce began to diversify both in occupation and in place of residence, with more migrants entering construction and the service sector.
Migration Trends
Total Immigration, Emigration, and Net Migration in Belgium
Source: after 1948 – Statbel, before 1948 – Thierry (to be updated for earlier years and with the proper source).
Alongside labour migration, Belgium also attracted a growing number of white-collar European professionals, especially as Brussels became the de facto capital of the European Union in the late 1950s (Petrovic, 2012).
In the late 1960s, as recession and unemployment rose, Belgium introduced more restrictive immigration policies. This shift contributed to a decade of negative net migration between 1978 and 1988. Net migration became positive again in the 1990s (see Figure 3), supported by the expansion of the European Union (Schoumaker et al., 2022).
Over the past 50 years, the origins of migrants coming to Belgium have become far more diverse. Labour migration has decreased, while family reunification has become increasingly important. Since the 1990s, Belgium has also experienced a steady rise in asylum applications, driven by conflicts both within Europe and elsewhere (Petrovic, 2012).
After the EU enlargements of the 2000s, arrivals from new member states increased sharply, especially from Romania. At the same time, global mobility more broadly expanded, reflected in Belgium’s positive net migration of around 50,000 people per year between 2010 and 2019 (Schoumaker et al., 2022).
Where Do Migrants Live?
Figure X. Share of foreign-born individuals (=migrants?) in total population by municipality
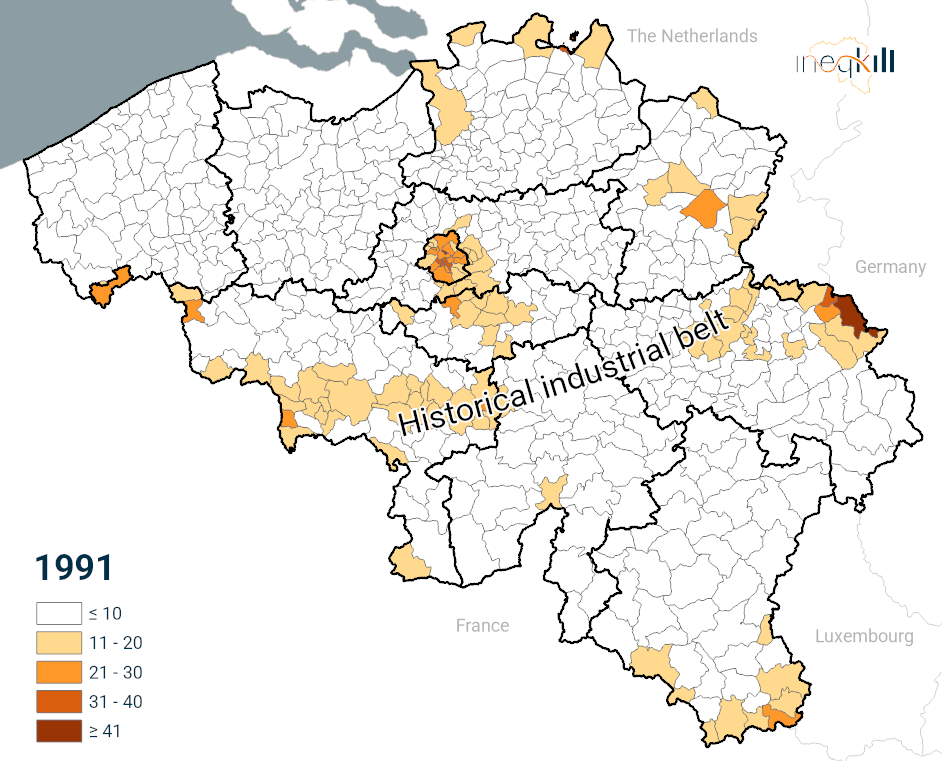
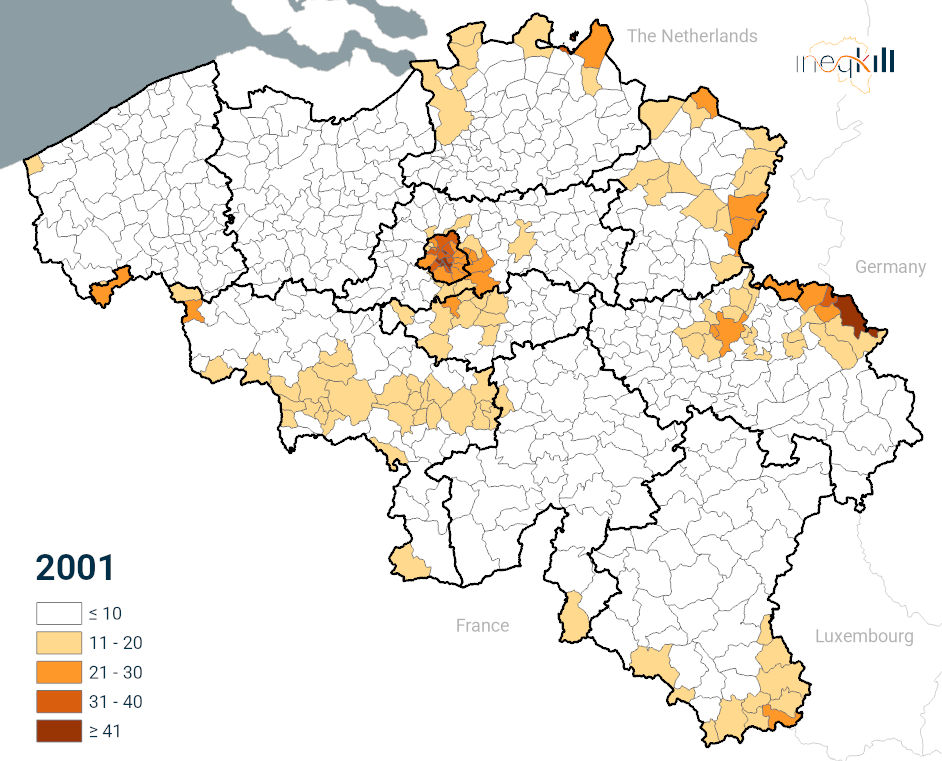
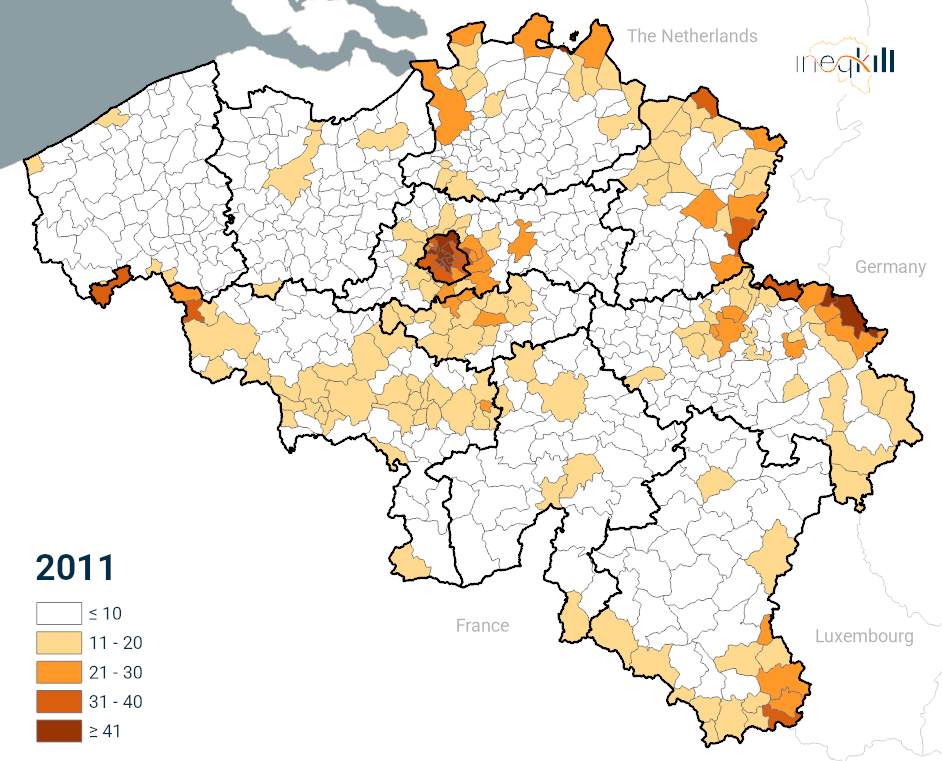
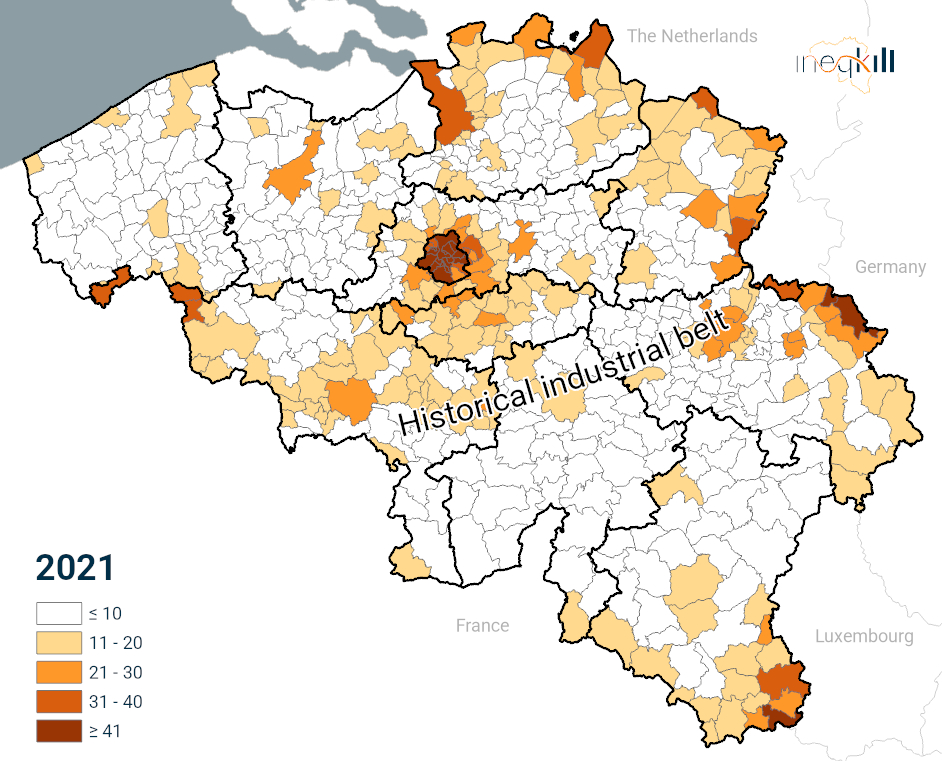
Source: Author’s calculations based on the census data
The migrant flows of the past continue to shape Belgium’s migrant population today. Even now, migrants remain present along the historic industrial belt.
By the 1960s, as the migrant labour force diversified, more migrants found work in construction and the service sector. At the same time, migrant communities began settling beyond the traditional industrial zones, increasingly favouring large urban areas – especially in Brabant (including Brussels), Antwerp, and East Flanders.
Cities offer both more job opportunities and the comfort of established communities where newcomers can find people of similar origins.
High concentrations of migrants also appear near Belgium’s borders. These are mainly European nationals from neighbouring countries who move only a short distance but end up residing across the border in Belgium.
Over time, the share of migrants in these areas has continued to grow, reflecting the overall increase in Belgium’s migrant population.
- Migrants from neighbouring countries. They make up a significant share of Belgium’s migrant population, and their numbers have remained fairly stable over time. These groups often settle in municipalities close to their home borders. In Wallonia, however, French-born residents dominate the migrant population in most municipalities.
- Italian migrants. Italians still stand out in the historic industrial belt. Even in 2021, they remain the most common foreign-born group in places like Mons, Liège, Charleroi, and surrounding municipalities.
- Migrants from countries of Eastern Europe. After the 2004 EU enlargement, the number of migrants from Eastern Europe, especially Poland and Romania, rose sharply. By 2021, they had become the largest migrant group in several municipalities in East and West Flanders, as well as in Flemish Brabant.
- Migrants from Morocco and Türkiye. These communities have their roots in the labour‑migration agreements of 1964. While this historical wave forms the foundation, later migration – through family reunification, marriage migration, and more recent individual arrivals – has also contributed to their growth and continuity. Although fewer newcomers have arrived from these countries in recent decades, their communities remain important. Many municipalities in Brussels and parts of Flemish Brabant (north of the capital) are dominated by these migrant groups.
- Migrants from Belgium’s former colonies. Migration from Democratic Republic of Congo as well as from Rwanda and Burundi was limited right after independence, but these populations have grown steadily over time (Lesthaeghe, 2000). They are now the largest minority in some municipalities east of Brussels, such as Aalst.
One way to examine settlement patterns is by looking at the most frequent country of birth among migrants in each municipality. This indicator highlights which migrant community is most represented locally, but it does not show the size of the migrant population itself. A municipality may appear on the map simply because one origin group is slightly more common than others, even if the total number of migrants there is small.
This way the whole past century of migrant flows to Belgium gets visualised. On the maps below we can see the most populous migrant groups.
Figure X. Most common foreign country of birth by municipality.


Source: Author’s calculations based on the census data
Do Migrants Live Longer?
Figure 7: Life expectancy at age 1 for Belgium-born, foreign-born, European, and Non-European migrants.
Source: Author’s calculations based on the census data and DEMOBEL.
Figure 7 shows that, in Belgium, as in many high-income countries today, migrants tend to live longer than people born in those countries. This pattern is often called the “healthy migrant effect.” On average, migrants have lower mortality rates and appear to be in better health when they arrive.
One key reason is that migration itself requires resources. Moving to another country often demands financial means, education, social networks, and the ability to adapt to new environments. In some cases, there are also basic health requirements for residence permits. Together, these factors mean that people who migrate are often, on average, healthier and more resilient than those who do not. When moving is relatively easy – such as within the European Union – health differences between migrants and native-born populations are much smaller, as we can see on the figure.
In Belgium, migrants generally live longer than people born in Belgium, those arriving from outside Europe, where migration is more difficult and selective, live the longest.
However, longer life expectancy does not necessarily mean better health in all areas. Migrants are more affected by certain risks, including infectious diseases. This might be linked to social and economic disadvantage such as living in smaller or more crowded housing. This disadvantaged socio-economic position also makes them more likely to die from accidents or violence. As we can see on figure 7, during the COVID-19 pandemic, these inequalities became more visible, and the usual survival advantage among migrants largely disappeared.
Where Do the Healthiest Migrants Live?
Figure 8: Life Expectancy at Age 1 of Foreign-Born by District
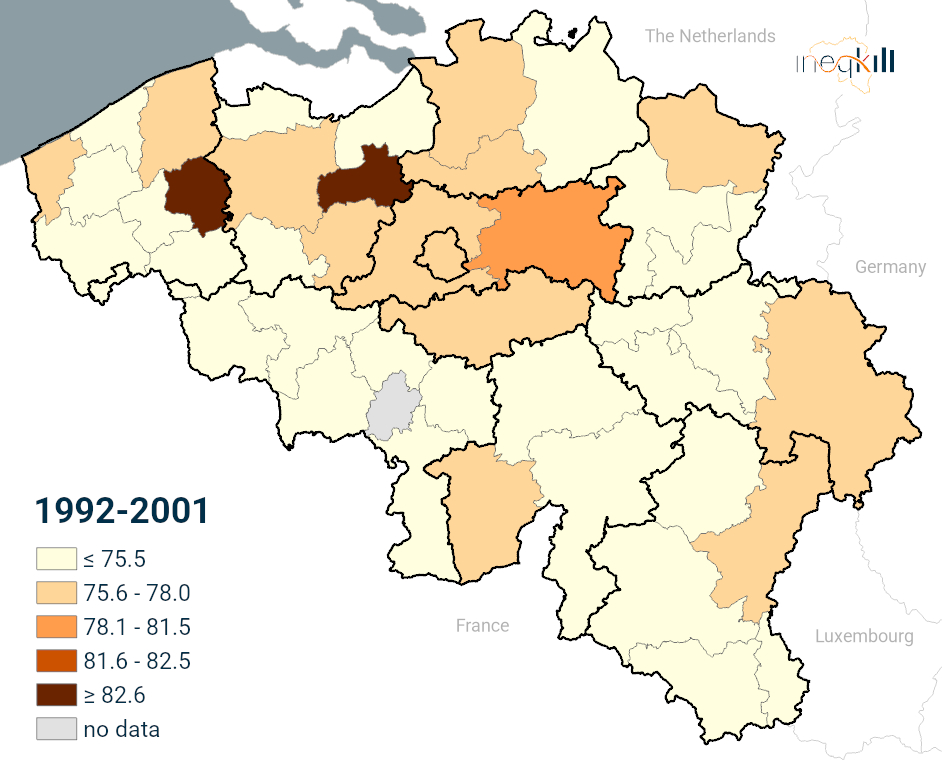
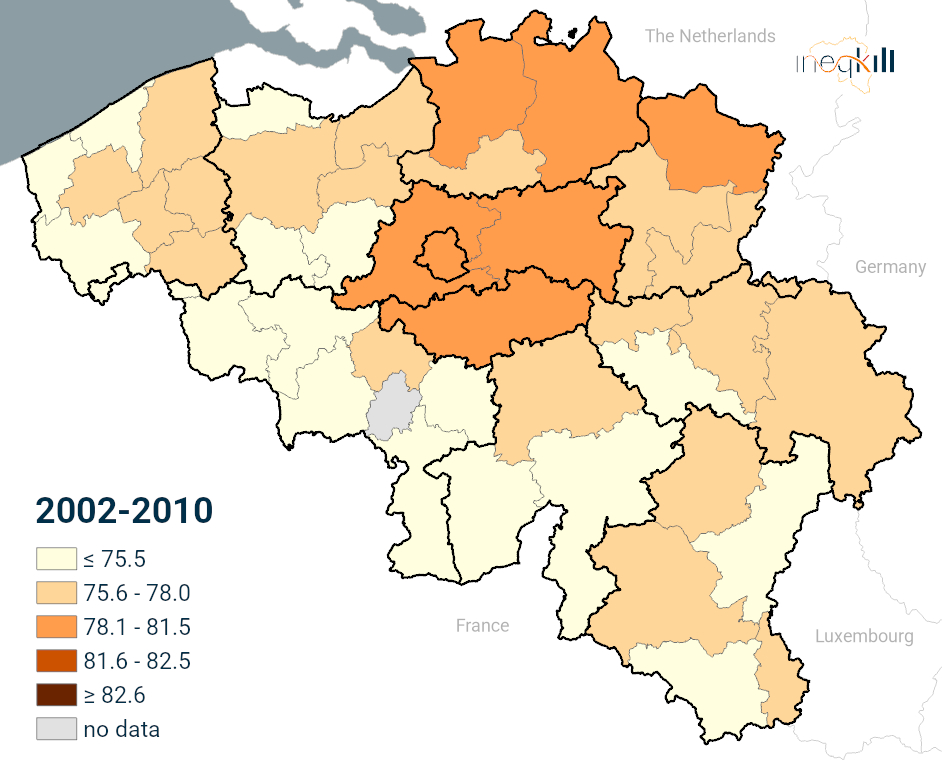
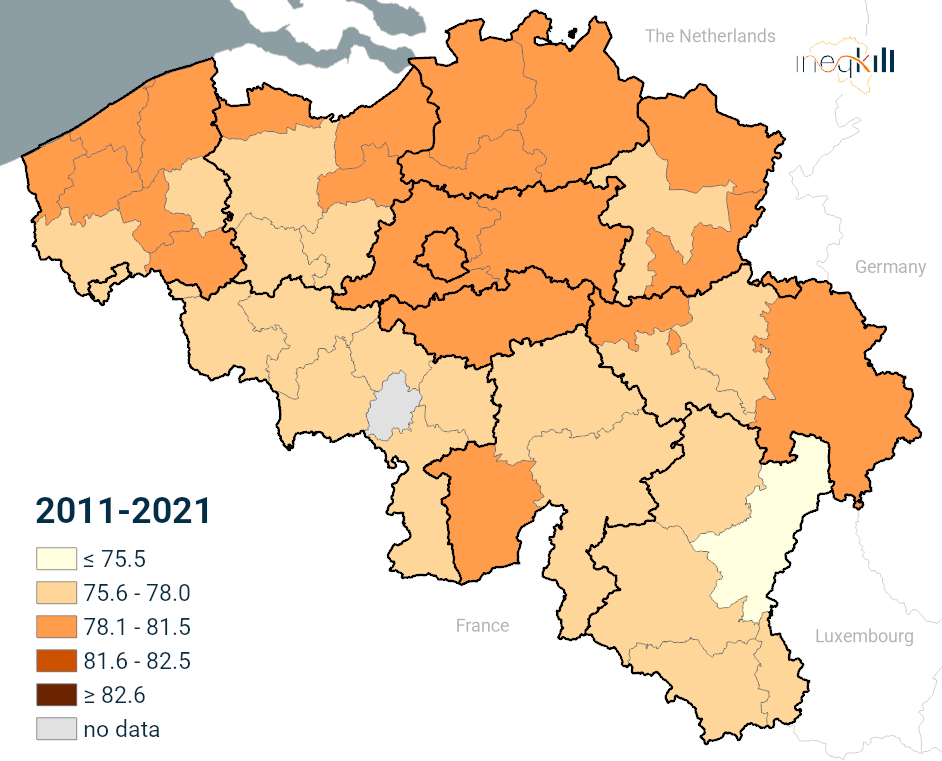
Source: Mean value for 1992-2001, 2002-2010, 2011-2021. Men. Data: author’s calculations based on the census data and DEMOBEL
Despite the large differences in migrants’ countries of origin across Belgian districts, there is surprisingly little spatial variation in their life expectancy. Overall, migrant life expectancy tends to be slightly higher in the north of the country, particularly in the districts of Flemish and Walloon Brabant, Antwerp, and Limburg. These regions consistently show life expectancies above the national migrant average, for both men and women. This slight northern advantage also reflects the broader mortality pattern in Belgium, where native‑born populations in Flanders consistently have higher life expectancy.
Some districts, however, show exceptionally high values that are unlikely to reflect real differences in health. For example, in 1992–2001, the districts of Tielt and Dendermonde (for men) appear as extreme outliers, with life expectancy estimates exceeding 80 years – far higher than anywhere else at the time. It is highly improbable that any real “longevity hotspot” existed among migrants in these areas three decades ago. Instead, these spikes are almost certainly data artefacts.
The reason is straightforward: in the early 1990s, many districts still had very small and very young migrant populations. When the population at risk is small, the number of deaths can be extremely low – sometimes close to zero in a specific district and period. Life expectancy is based on the observed number of deaths, so unusually few deaths can mathematically inflate life expectancy to unrealistic levels. Even a single additional death (or the absence of one) can shift the estimate dramatically.
As migrant populations grew in size and grew older over time these artefacts became less common. The estimates for the 2000s and especially the 2010s look much more stable. The regional differences narrow, and the extreme outliers disappear.
Figure 8: Life Expectancy at Age 1 of Foreign-Born by District.
Men
Women
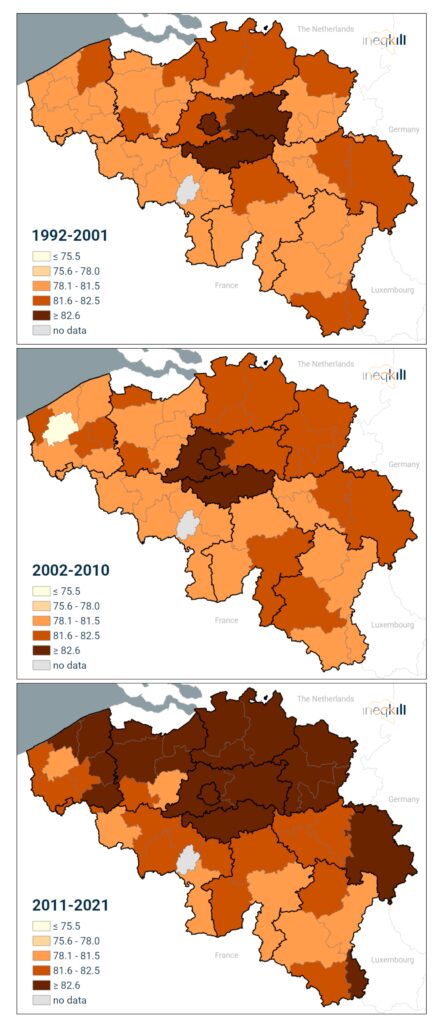
Source: Mean value for 1992-2001, 2002-2010, 2011-2021. Data: author’s calculations based on the census data and DEMOBEL
Despite the large differences in migrants’ countries of origin across Belgian districts, there is surprisingly little spatial variation in their life expectancy. Overall, migrant life expectancy tends to be slightly higher in the north of the country, particularly in the districts of Flemish and Walloon Brabant, Antwerp, and Limburg. These regions consistently show life expectancies above the national migrant average, for both men and women. This slight northern advantage also reflects the broader mortality pattern in Belgium, where native‑born populations in Flanders consistently have higher life expectancy.
Some districts, however, show exceptionally high values that are unlikely to reflect real differences in health. For example, in 1992–2001, the districts of Tielt and Dendermonde (for men) appear as extreme outliers, with life expectancy estimates exceeding 80 years – far higher than anywhere else at the time. It is highly improbable that any real “longevity hotspot” existed among migrants in these areas three decades ago. Instead, these spikes are almost certainly data artefacts.
The reason is straightforward: in the early 1990s, many districts still had very small and very young migrant populations. When the population at risk is small, the number of deaths can be extremely low – sometimes close to zero in a specific district and period. Life expectancy is based on the observed number of deaths, so unusually few deaths can mathematically inflate life expectancy to unrealistic levels. Even a single additional death (or the absence of one) can shift the estimate dramatically.
As migrant populations grew in size and grew older over time these artefacts became less common. The estimates for the 2000s and especially the 2010s look much more stable. The regional differences narrow, and the extreme outliers disappear.
Figure XX: Percentage of migrant mortality advantage in life expectancy at age 1 by district
Men
Women
Source: Mean value for 1992-2001, 2002-2010, 2011-2021. Data: author’s calculations based on the census data and DEMOBEL
The more interesting question is not the absolute level of migrant life expectancy, but how migrants compare to natives. When we look at relative life expectancy, the picture changes completely from what we saw for absolute levels. Migrants tend to live slightly longer in Flanders than in Wallonia – but the native-born population does too. In Flanders, overall mortality is already low and life expectancy is very high for everyone, which leaves migrants with little room to show an additional advantage. Their life expectancy, although high, sits very close to the already high life expectancy of the native population.
In Wallonia, the situation is different. Native life expectancy is lower than in Flanders, so even if migrants have similar absolute life expectancy as elsewhere, their relative advantage is larger. In other words, migrants appear to outperform natives more visibly simply because native life expectancy is lower to begin with.
The gap is most pronounced among men. In Wallonia, male migrants show a clear survival advantage compared to native-born men. In several Flemish districts, however, migrant men actually have lower life expectancy than natives. The same general pattern appears among women, but the differences are smaller. Female life expectancy varies less across districts in general, which reduces the contrast between migrant and native women.
Taken together, these patterns show that migrant advantage is not a fixed value. It depends heavily on the characteristics of the native-born population. Where native life expectancy is high, migrants have little room for an additional edge; where it is lower, the migrant advantage becomes much more visible.
Migrants Lose their Advantage with Increasing Duration of Stay
Figure XX: Life expectancy at Age 1 of Foreign-Born by Duration of Residence in Belgium. Men
Source: Mean value for 1992-2001, 2002-2010, 2011-2021. Data: author’s calculations based on the census data and DEMOBEL.
In many countries, including Belgium, the migrant mortality advantage tends to shrink the longer migrants live in the host country. They have been selected to be healthy, and did not have time to develop any diseases yet. But over time, migrants become more similar to the native population. They gradually adopt local lifestyles, diets, and healthcare practices, which brings their health patterns closer to those of natives. At the same time, stress from a new environment, financial insecurity, discrimination can build up with longer duration of stay, which may also reduce the initial health advantage.
There is also a simple statistical reason why the migrant advantage tends to decline. Migrants start out, on average, healthier than the native population. When a group begins at the very top of the health distribution, any random health changes over time – illness, accidents, ageing, or just chance – tend to move them closer to the average rather than further above it.
Belgian data, however, tell a more complex story. Migrants with a shorter duration of stay do have higher life expectancy than natives, but the gap does not start narrowing right away. Instead, the advantage actually grows during the first years after arrival. Migrants who have lived in Belgium for 6–10 years show the highest life expectancy of all. Only after more than a decade in the country do migrants begin to resemble natives more closely in terms of mortality, and even then they continue to maintain a small advantage. This pattern suggests that the healthy migrant effect is not immediate—migrants often continue to benefit from their initial health selection and favourable characteristics for several years before the gradual processes of adaptation, accumulated challenges, and statistical convergence begin to reduce their advantage.
Our Publications
Vergeles, Marina. (Forthcoming), title of you Phd Dissertation
Literature
- Aldridge, R. W., Nellums, L. B., Bartlett, S., Barr, A. L., Patel, P., Burns, R., Hargreaves, S., Miranda, J. J., Tollman, S., Friedland, J. S., & Abubakar, I. (2018). Global patterns of mortality in international migrants: A systematic review and meta-analysis. The Lancet, 392(10164), 2553–2566. https://doi.org/10.1016/S0140-6736(18)32781-8
- Ikram, U. Z., Mackenbach, J. P., Harding, S., Rey, G., Bhopal, R. S., Regidor, E., Rosato, M., Juel, K., Stronks, K., & Kunst, A. E. (2016). All-cause and cause-specific mortality of different migrant populations in Europe. European Journal of Epidemiology, 31(7), 655–665. https://doi.org/10.1007/s10654-015-0083-9
- Lesthaeghe, R. J. (Ed.). (2000). Communities and generations: Turkish and Moroccan populations in Belgium. VUB University Press.
- Petrovic, M. P. M. (2012, November 15). Belgium: A Country of Permanent Immigration. Migrationpolicy.Org. https://www.migrationpolicy.org/article/belgium-country-permanent-immigration
- Reus-Pons, M., Vandenheede, H., Janssen, F., & Kibele, E. U. B. (2016). Differences in mortality between groups of older migrants and older non-migrants in Belgium, 2001–09. European Journal of Public Health, 26(6), 992–1000. https://doi.org/10.1093/eurpub/ckw076
- Roelfs, D. J., & Shor, E. (2022). The Effects of Ethno-cultural Origin–Destination Interactions on Immigrants’ Longevity. Journal of Immigrant and Minority Health, 24(5), 1345–1366. https://doi.org/10.1007/s10903-021-01245-0
- Schoumaker, B., Guen, M. L., Caron, L., & Nie, W. (2022). Multiple (il)legal pathways: The diversity of immigrants’ legal trajectories in Belgium. Demographic Research, 47, 247–290.
- Shor, E., & Roelfs, D. (2021). A Global Meta-analysis of the Immigrant Mortality Advantage. International Migration Review, 55(4), 999–1028. https://doi.org/10.1177/0197918321996347
Sources
- Statistics Belgium
- Myria, the Belgian Federal Migration Centre
- Demobel database
The Ineqkill Atlas of Mortality Inequalities in Belgium provides detailed information about mortality and diseases in Belgium from 1820 to 2025.
About
- Ineqkill Research Project
- Mission Statement
- Team
- FAQ's
Vrije Universiteit Brussel
Pleinlaan 5 (Room 2.17)
1050 Brussels, Belgium
e-mail: sylvie.gadeyne@vub.be

