
When did mortality start to decline in Belgium?
Before the 19th century, death in Belgium, as elsewhere in Europe, followed an unpredictable rhythm, driven by harvest failures, epidemics, and the limits of contemporary medicine. Over the course of the 1800s, this began to change. Death rates entered a long-term decline that would eventually reshape population growth and life expectancy. This shift, called the mortality transition, ranks among the most consequential demographic changes of the modern era. But it did not unfold everywhere at once, nor at the same pace for everyone.
This page presents maps and a video that show when Belgian municipalities began to experience a sustained decline in mortality between 1841 and the First World War. Lets see where and when people started to die less.
Knowing exactly when and where the decline began matters, because it helps us trace the forces behind it: better nutrition, improved sanitation, advancing medical knowledge, and the slow build-up of public health infrastructure.
Where decline began first
The map and video below both show that the decline did not begin everywhere at the same time.

Local clusters and possible explanations
Clusters of early and late mortality decline in Belgium
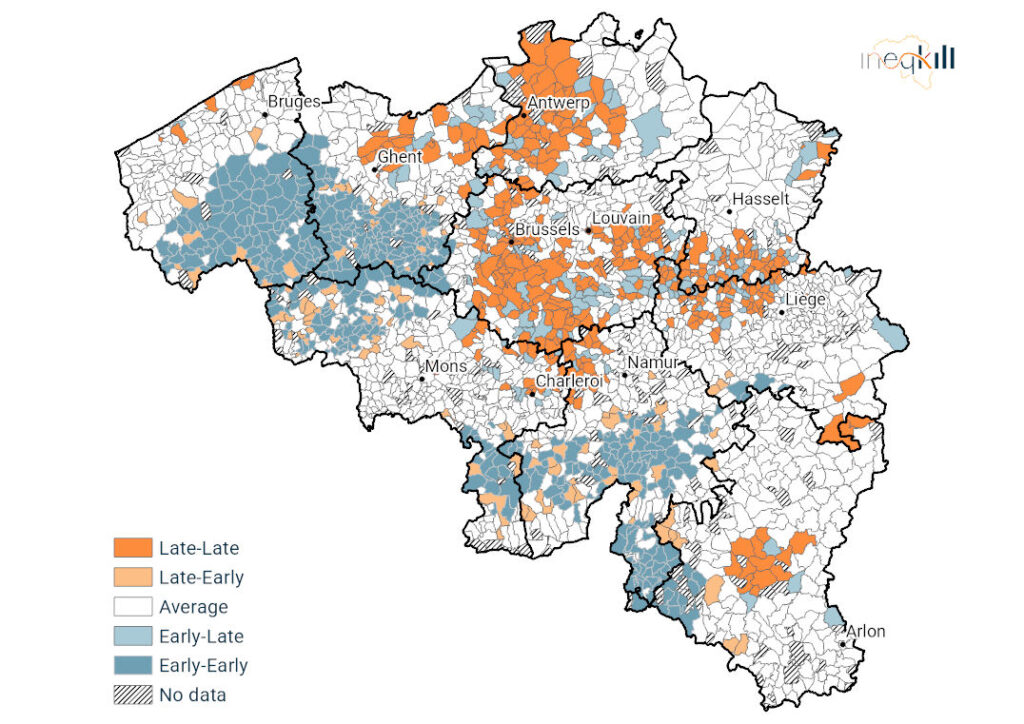
Municipalities coloured by clusters according to the period of decline:
- Early-Early (dark blue – early decline correlated with early decline among neighbouring municipalities),
- Early-Late (light blue – early decline correlated with late decline among neighbours),
- Average (white – no clustering: median),
- Late-Early (salmon – late decline correlated with early decline: median),
- Late-Late (red – late decline correlated with late decline.
Does this pattern simply trace the familiar Wallonia–Flanders divide? The second map suggests the answer is more nuanced. It tests whether neighbouring municipalities followed similar trajectories, revealing distinct clusters of early decline and clusters of late decline. This clustering tells us that mortality levels were not changing independently from one municipality to the next – local conditions clearly mattered. Nearby places likely shared environments, food systems, exposure to epidemics, public health measures, and broader approaches to disease.
The early decline visible in parts of Flanders may partly reflect a kind of statistical rebound: these regions had endured severe mortality crises earlier in the 19th century, so when nutrition, sanitation, or disease control later improved, the resulting decline stood out all the more clearly.
Southern Namur appears to tell a different story. There, mortality was already comparatively low earlier in the century, and the decline visible around 1840 may largely represent a return to that lower baseline following a temporary worsening during the 1830s.
Late-declining municipalities, by contrast, were more scattered across the map – some sitting right beside places where decline had already begun. This scattered pattern reinforces the point: Belgium’s mortality decline did not simply follow the Wallonia–Flanders line. It followed more intricate, local geographies.
From local geography to national change
Together, the two maps point to a broader pattern: geography mattered most for much of the 19th century. Across most of Belgium, mortality levels were strongly linked between neighbouring municipalities, meaning nearby places often shared similar conditions. But after the late 1890s, this spatial link weakened markedly. By then, mortality decline had begun almost everywhere in the country.
This shift suggests that, over time, broader forces gradually overtook purely local ones. Improvements in transport, medical knowledge, public health policy, food supply, and living standards likely helped carry mortality decline across the whole country, smoothing out the local unevenness that had defined earlier decades.
Taken together, the maps show that Belgium’s mortality decline was not a single national event happening everywhere at once. It was a gradual and uneven process — shaped first by local conditions, and later by wider social, economic, and public health change.
Explore more articles Major trends in mortality