
Cholera
The deadliest epidemic in Belgian history
By Isabelle Devos
Imagine a disease so deadly that nearly half of those it touched would not survive.
In 19th-century Belgium, cholera swept through cities and countryside multiple times, leaving devastation in its wake.
The poor suffered the most, but the severity of the disease meant that the wealthier social classes could not escape its grasp.
Was it simply bad luck, or did deeper patterns of inequality determine who lived and who died?
Image: Cholera as the Grim Reaper, drawing from “L’espiègle: Journal Satirique, Politique, Artistique et Littéraire”, Brussel, 1866. (© Public Domain)
What is cholera?
What is cholera?
Cholera is a waterborne disease caused by the bacterium Vibrio cholerae, typically acquired through the consumption of contaminated water. Symptoms include severe watery diarrhoea, vomiting, muscle cramps, and rapid dehydration which can lead to death.
Where does it occur?
The bacterium Vibrio cholerae is native to coastal waters of the Indian subcontinent but it can spread to other parts of the world through infected people and in contexts with poor sanitation.
Diagnosis and treatment
Today, cholera is diagnosed with stool tests and treated with oral or intravenous rehydration and antibiotics. In the 19th century, diagnosis relied on symptoms, and effective treatment was unavailable.
Prevention and control
Efficient separation of sewage and consumption water is central to cholera prevention. A vaccine exists since the 1990s but it is not routinely recommended.

Cholera in Europe
Cholera has a long history, with evidence of outbreaks dating back to ancient times. But it was not until the early 19th century that the disease entered Europe as part of the first global pandemic. From Asia, it spread westwards along expanding trade and transport routes. By the 1830s, cholera was sweeping across much of Europe. Fast-growing industrial cities proved especially vulnerable. Overcrowding and poor sanitation created ideal conditions for cholera to spread.
At the time, however, people did not know that cholera was waterborne. Many doctors believed that it was caused by poisonous air, or “miasmas”, rising from polluted canals, streams and other places where human and animal waste accumulated. In the 1850s, the English physician John Snow demonstrated the link between cholera and contaminated water. But it was not until 1883 that Robert Koch identified the bacterium Vibrio cholerae.
Cholera today
Cholera has not disappeared. Today, cholera is estimated to cause over 2 million cases and 90,000 deaths globally each year. The disease remains a challenge in areas where infrastructure for water and sewage is inexistent, insufficient or not functioning.
The WHO estimates that over 1.5 billion people don’t have access to safe sanitation, and 1.7 billion people consume water contaminated with faeces.
In reality, cholera outbreaks were mainly caused by contaminated drinking water. Before the late 1800s, most people used shared wells and rivers for water.
In the 1850s, the English physician John Snow identified unsafe water as a source of contamination. However, the disease was not fully understood until 1884 when Robert Koch discovered that it is caused by the bacteria Vibrio cholerae. From then on, the transmission could be clarified.
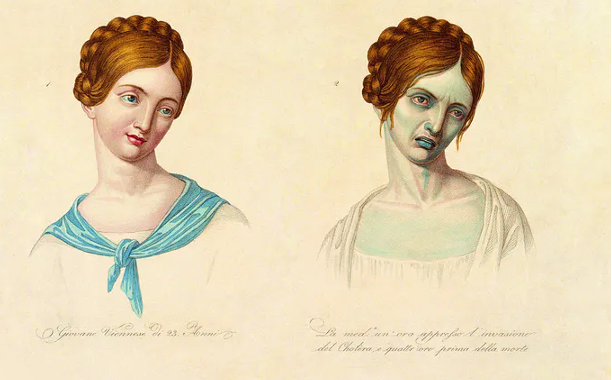
Cholera is a waterborne bacterial infectious disease and is accompanied by symptoms such as vomiting and diarrhoea, which can result in death from dehydration. Victims often develop a bluish skin colour, making the disease known as the “blue death” (figure 1).
Figure 1: Cholera or the "Blue death"
Cholera in Belgium
Belgium experienced several major cholera epidemics during the 19th century. The first major outbreak struck in 1832–1833, killing 7,984 people. A much more severe epidemic followed in 1848–1849, when large parts of the population—particularly in Flanders—had already been weakened by years of food shortages and economic hardship. More than 23,000 people died. But the worst was still to come. In 1866, cholera killed more than 43,000 people. The last outbreak in the 1890s was far less deadly.
Figure 2: Cholera epidemics in Belgium
Source: Documents statistiques 1857-1869; Annuaire statistique, 1870-1885; State Archives Brussels, Mouvement de la population, 1886-1930.
The outbreak of 1866
The epidemic of 1866 was extraordinary. Cholera alone accounted for nearly one in three deaths recorded in Belgium that year. The disease entered the country in March from several directions, continued to claim lives until early December and reached its deadliest point during the summer.
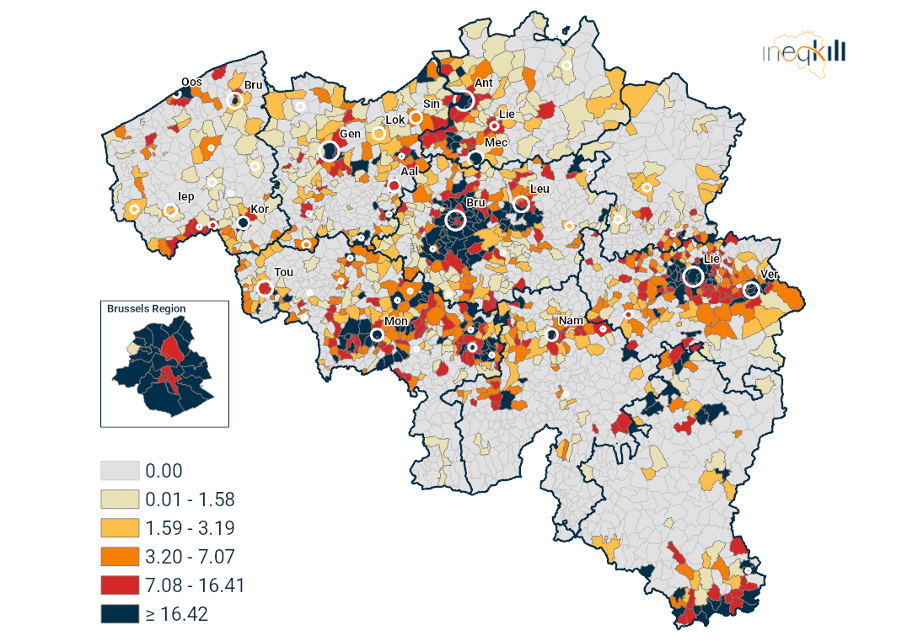
But cholera did not strike everywhere equally. Figure 3 shows mortality across Belgian municipalities. Cities were particularly badly affected. Brussels stands out, but mortality was also high in Mons, Ghent, Antwerp, Verviers, Liège and Namur.
Some smaller towns, including La Roche-en-Ardenne and Geraardsbergen, suffered exceptionally high losses, even accounting for most deaths recorded in that year. Most rural villages escaped the worst of the epidemic, although there were important exceptions, including several villages near the Luxembourg border, such as Aubange, Messancy and Bleid. Learn more about the spread of cholera in the countryside in this article.
The 1866 outbreak was the deadliest epidemic in Belgian history. But who was most at risk—and why?
Figure 3: Number of cholera deaths per 10,000 inhabitants by municipality, 1866
The 1866 epidemic of Brussels
Figure 4: Cholera deaths by day in Brussels
Source: Ghent University, Quetelet Center.
Brussels was hit particularly hard. In 1866, cholera killed 3,469 people in the city, accounting for almost half of all deaths in that year. Where did the epidemic start? How did it move through the city? And who did it kill? The time-lapse video in Figure 4 traces cholera deaths day by day as the epidemic unfolded.
The first victims
The first recorded victim was Catherine Ravaiau, a 66-year-old widow who died on 26 May 1866. She worked as a rag picker and lived with her sister at Vieux Marché 32, in a modest house in an alley close to the river Senne. Several households shared the building. Within days, two more residents of the same address had died, while cases also appeared in nearby houses. The situation quickly became so alarming that the mayor ordered all residents of the alley to be evacuated.
From this working-class neighbourhood, cholera quickly spread south and southwest through the city. By mid-June, it had also reached working-class areas in northern and eastern Brussels, and the death toll was rising rapidly. Around 15 people were now dying of cholera each day. A month later this number had already tripled. Brussels hospitals struggled with staff shortages, and the police had to step in to transport the sick and the dead.
From poor to wealthy neighbourhoods
At first, cholera was concentrated in poorer parts of the city. By July, however, it was also spreading into wealthier neighbourhoods, as measured by their average cadastral income—the estimated rental value of property and a useful indicator of neighbourhood wealth. The disease eventually reached all sections of Brussels, but the wealthier parts of the city were hit later and generally escaped the worst of the epidemic for several weeks.
The epidemic reached its peak on 25 and 26 August, when 62 people died on each day. Mortality then gradually declined. By mid-November, almost six months after the first death, the epidemic had run its course.
The contrast between its first and last recorded victims is striking. Catherine Ravaiau was a rag picker living in a crowded alley. The final recorded victim, Nathalie Pollenus, was the 59-year-old wife of a lawyer and died on 16 November in their townhouse on Rue Royale.
Figure 5: Number of cholera deaths per day, Brussels, 1866
Source: City Archives Brussels, Police Archives, red series 83-86; calculations by the authors.
Who were the victims?
Figure 6: Age-specific rates of cholera deaths, Brussels 1866
Source: City Archives Brussels, Police Archives, red series 83-86; calculations by the authors.
The cholera outbreak in Brussels of 1866 caused many deaths among children below age 10 and among adults aged 20 to 49. However, this can partly be explained by the fact that these were the biggest age groups in the population at that time. When we adjust for the number of people in each age group, a clearer pattern appears (figure 6).
The people with the highest risk of dying were young children and older adults (60 and above). Teenagers had the lowest risk. Men were a bit more at risk than women, except among those aged 60 to 79.
Which social backgrounds were most vulnerable? When we divide all the victims in groups according to the cadasteral value of the houses they lived in, we see that populations living in houses with an average lower cadastral income, were hit particularly bad during the epidemic.
Figure 7 shows a clear relationship between the social categories (from very low and low to high and very high cadastral income) and the number of deaths per category over time: if we assume that poorer people lived in houses with low cadastral income, while richer people lived in houses with higher cadastral income, higher numbers of cholera deaths occurred in the ‘poor’ categories, while the ‘richest’ groups counted the least victims.
During the months of June and July, most victims fell in houses with low and very low incomes. The epidemic reached a peak at the beginning of August. In houses with high and very high incomes, the peek occurred later, in September, and was much lower.
Figure 7: Number of cholera deaths per cadastral income group over time, Brussels 1866
Source: Quetelet Center, Database POPPKAD; calculations by the authors.
How did the disease spread?
Figure 8: Location of buildings with more than one deaths, and time-interval between first and last death

In the late 1850s, Brussels was the first Belgian city to develop a public water supply network. But by 1866, access to clean water was still far from universal. Working-class homes and crowded alleys were connected to the network much more slowly, and many residents continued to rely on public fountains, pumps and wells. These could become contaminated by waste leaking from nearby cesspits or by other sources of pollution.
Figure 8 provides an important clue to how cholera spread. It shows houses where more than one person died of the disease and the time between these deaths. The larger the red circle, the longer the interval. In many houses, deaths occurred days or even weeks apart—longer than cholera’s incubation period, which is usually no more than five days. This suggests that cholera was not simply passed from one household member to another. It makes single chain of transmission within the household less likely. Instead, residents may have been repeatedly exposed to contaminated water during the epidemic.
The blue areas on the map provide another clue. They show parts of Brussels within 50 metres of buildings without piped water. Residents in these areas depended more heavily on wells, pumps and public fountains, increasing their risk of exposure to contaminated water. This helps explain why poorer parts of Brussels were hit so hard. Limited access to clean water did not create a single moment of danger: it exposed residents to risk again and again throughout the epidemic.
This helps explain why cholera hit poorer parts of Brussels particularly hard. But contaminated water did not stop at neighbourhood boundaries. Cholera deaths occurred across the city, including in wealthier areas. Access to piped water reduced the risk of infection, but did not eliminate it.
Cholera exposed the cost of inequality
Figure 9: Cholera as the grim reaper
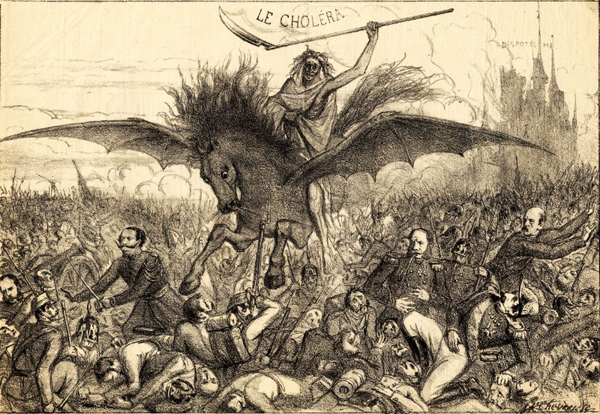
Drawing by unknown author (source: L’espiègle: Journal Satirique, Politique, Artistique et Littéraire, Brussels, 1866).
Cholera did not strike Brussels at random. The disease eventually reached every social class, but the urban poor paid the highest price. They were more likely to live in overcrowded neighbourhoods with poor sanitation and limited access to clean water. These conditions increased their exposure and made cholera much harder to escape. The epidemic therefore tells us more than the history of a disease. It reveals how closely health was tied to where people lived and the resources they could access. Clean water, sanitation and decent housing were not simply matters of comfort. During a cholera epidemic, they could mean the difference between life and death.
Our publications
- Devos I. (2020). De cholera-epidemie van 1866 in Brussel: een reconstructie. Ghent: Quetelet Center.
- The Cholera epidemic in Brussels: a reconstruction. [Video]. (Last consulted 22 September 2026).
Read more
- Bertels, I., De Munck, B., & Van Goethem, H. (eds.). (2010). Antwerpen: biografie van een stad. Antwerpen: De Bezig Bij.
- Boeckx, K. (2007). 13 mei 1866: cholera maakt 3.000 doden. In De 25 dagen van Antwerpen. Amsterdam: Waanders.
- Eggerickx, T., & Poulain, M. (1988). L’épidemie de choléra en 1866: le cas de Belgique. In Bardet J.-P. et al. Peurs et terreurs face à la contagion: choléra, tuberculose, syphilis, XIXe-XXe siècles. (pp. 56-82). Paris: Fayard.
- Falise, C. (1979). Le cholera à Bruxelles en 1866. Annales de la Société belge d’histoire des hôpitaux, 17, 81-104.
- Janssens, E. (1868). Recherches statistiques sur la a mortalité dans la ville de Bruxelles. Bruxelles: Manceaux.
- Van Craenenbroeck, W. (1998). Antwerpen op zoek naar drinkwater: het ontstaan en de ontwikkeling van de openbare drinkwatervoorziening in Antwerpen, 1860-1930. Tielt: Lannoo.
- Van de Vijver, S. (1969). Cholera te Antwerpen in de 19de eeuw. Gent: Unpublished master’s thesis UG.
Viré, L. (1973). La distribution publique d’eau à Bruxelles, 1830-1870. Bruxelles: Crédit communal de Belgique.
Data sources
- Annuaire statistique de la Belgique, 1870-1885.
- De Welle, Distribution d’eau de la ville de Bruxelles, 1867.
- Documents statistiques de la Belgique,1857-1869.
- State Archives Brussels, Mouvement de la population et de l’état civil, 1886-1930.
- City Archives Brussels, Police Archives, red series 83-86.
- Ghent University, Quetelet Center, Databases HISSTER, LOKSTAT , POPPKAD and S.O.S. Antwerp.