
Alcohol's underestimated death toll
By Caterina Mauri
For most of Belgium’s history, alcohol killed almost no one, at least on paper. While Zola’s L’Assommoir (1877) was laying bare the devastating human cost of drinking in working-class Paris, in Belgium, officially, alcoholism accounted for only 4 out of every 1000 deaths at its pre-war peak in the early 1900s.
Today, we know alcohol is responsible for many more deaths than just those that appear in records as due to alcoholism. This article explores the death toll, both historical and modern, of Belgium’s favourite drug.
Image: The old Inn Het Loodshuis in Antwerp by Henri De Braekeleer, 1877 (source: KMSK Antwerp).
What is alcoholism?
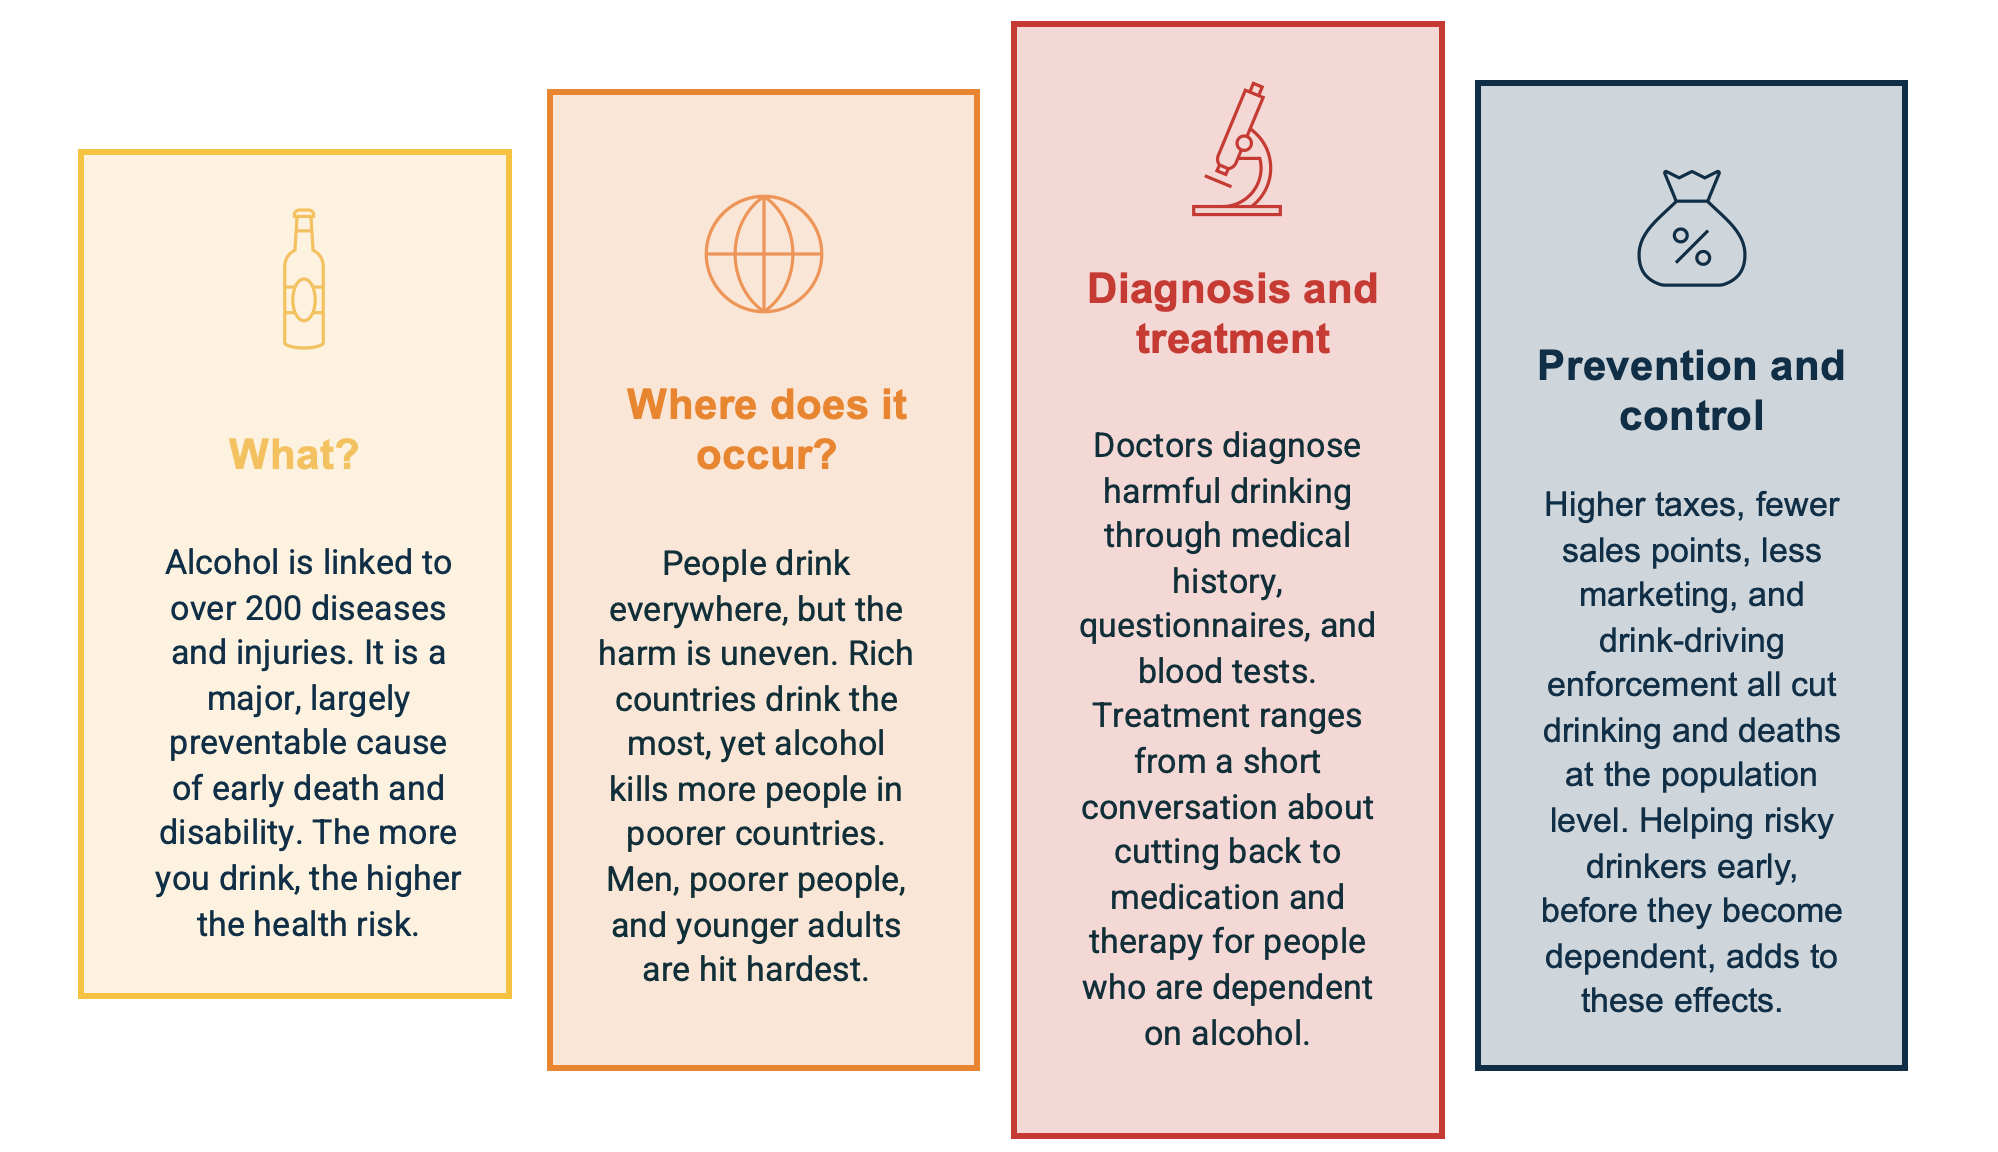
What?
Alcohol is linked to over 200 diseases and injuries. It is a major, largely preventable cause of early death and disability. The more you drink, the higher the health risk.
Who does it affect? Where does it occur?
People drink everywhere, but the harm is uneven. Rich countries drink the most, yet alcohol kills more people in poorer countries. Men, poorer people, and younger adults are hit hardest.
Diagnosis and treatment
Doctors diagnose harmful drinking through medical history, questionnaires, and blood tests. Treatment ranges from a short conversation about cutting back to medication and therapy for people who are dependent on alcohol.
Prevention and control
Higher taxes, fewer sales points, less marketing, and drink-driving enforcement all cut drinking and deaths at the population level. Helping risky drinkers early, before they become dependent, adds to these effects.
History of alcohol consumption in Belgium
Figure 1: In Belgium, alcohol was woven into daily life

Throughout history, alcohol consumption has played an important role in social life, helping to foster social connections and bonding among people. Yet the harmful effects of alcohol, particularly when consumed in large amounts, have been known since ancient times. Pliny the Elder, a Roman author and natural philosopher, noted that many Romans were driven to death by alcohol, while Galen, an influential Greek physician, cautioned against its use among children.
In 18th-century Belgium, alcohol was woven into daily life in ways that are difficult to appreciate today. The dominant beverage was beer, consumed by men, women, and children alike — including at mealtimes. This was not mere indulgence: before reliable municipal water supplies, beer was widely regarded as safer to drink than water, and the thousands of local breweries that dotted the country made it the cheapest and most accessible staple drink. Alcohol content was low (1 or 2%) and consumption was considered normal. Table beer remained popular during a large part of the twentieth century but lost market share to soft drinks in the past decades.
By the second half of the 1800s, Belgium had a serious alcohol problem. What changed over the course of the century was the rise of distilled spirits. Industrial production made cheap, highly alcoholic spirits widely available, even to the poor. Drinking establishments were opening on virtually every street corner. By 1900, Belgium had the highest density of bars and cafés in Western Europe: roughly 1 for every 11 adult men. Annual alcohol consumption exceeded 12 litres of pure alcohol per person (compared with, for example, around 8 in the UK, 11 in Italy, and 16 in France), with distilled spirits alone accounting for close to 10 litres per inhabitant by the 1880s (Annuaire sanitaire, 1913). Nor was consumption restricted to adults: children drank alongside them, and it was only after 1887 that minors under 16 were legally barred from being served in public houses.
Meanwhile, doctors had begun keeping track of how alcohol made people sick and how it killed them. Swedish physician Magnus Huss coined the term alcoholismus chronicus in 1849 to describe what happens to the body after years of heavy drinking, separate from an acute short-lived condition he called alcoholismus acutus. Already in the 1870s, some Belgian municipal death records mentioned alcoholic delirium (délire alcoolique) and drunkenness (ivrognerie). Since 1886, alcoholism is one of the causes of death systematically mentioned in Belgian vital statistics records, the Mouvement de la Population et de l’état civil. Death records recognised both chronic alcoholism and acute intoxication (alcoolisme aigu ou chronique) as causes of death but did not distinguish them in the records until 1957.
Figure 2: In 1911, Belgium counted 15 anti-alcohol societies with over 110,000 members
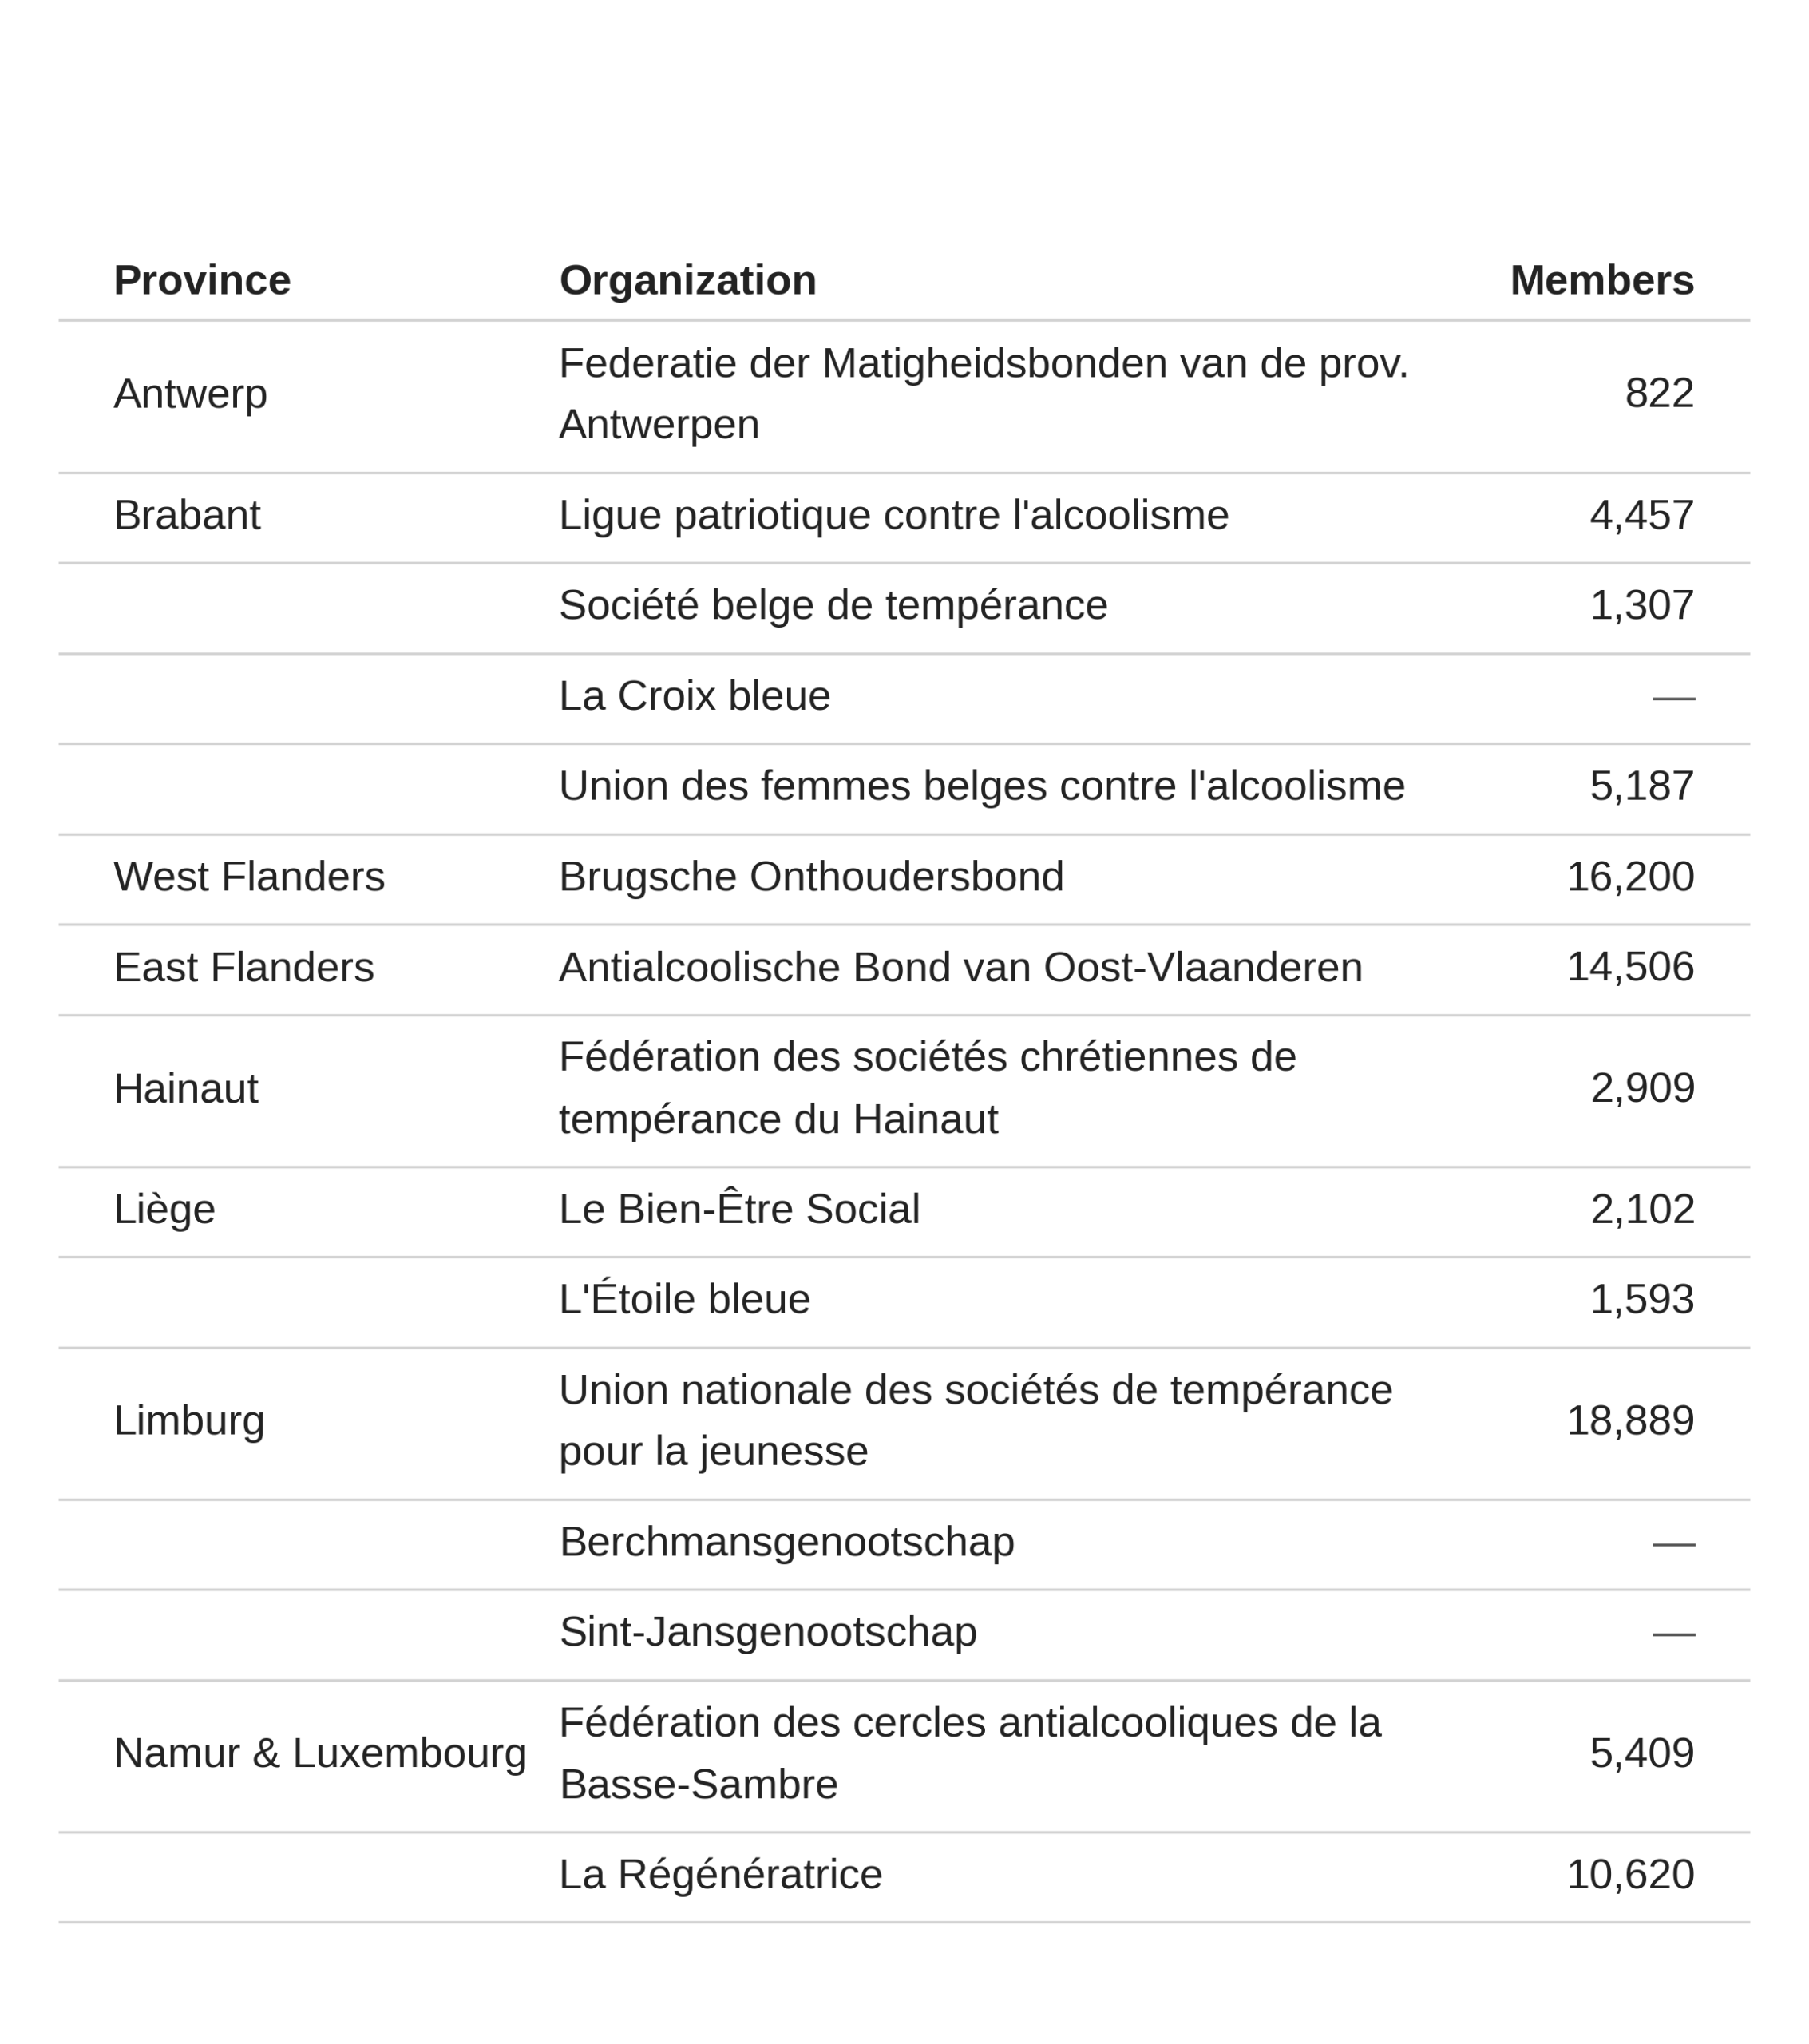
Source: Annuaire statistique de la Belgique, 1913
Figure 3: Belgium's temperance societies spread their message through their own press, such as the Journal de la Ligue patriotique contre l'alcoolisme

With drunkenness everywhere in public life, the political debate was not far behind. In the early 20th century, public health concerns gave rise to temperance movements across Europe and North America. In 1911, Belgium had 15 organized anti-alcoholism societies across the country with close to 110,000 members (Figure 2) and, in addition, one specifically for women and a medical society for the study of alcoholism. These societies promoted abstinence pledges, organized lectures and educational campaigns, published pamphlets and many had their own journals (e.g., Journal de la Ligue patriotique contre l’alcoolisme – Figure 2 – or Clairière, a periodical by the Union des femmes Belges contre l’alcoolisme). They pressured government for regulation of alcohol sales. Although Belgium never adopted full prohibition like the United States (1920–1933), worries about alcohol’s health and social harms led to new limits on making, selling, and drinking it.
In Belgium, a key milestone was the Vandervelde Law of 1919 (officially lifted only in 1984!), which prohibited the sale of spirits in pubs. Spirits could still be purchased for consumption at home, in quantities of at least 2 litres. This affected such drinks as the previously popular genever (jenever), which contains generally around 50% alcohol by volume.
Incidentally, this may have contributed to the rise of the strong beers Belgium is now famous for, as the sale of beer in pubs remained legal. Dubbels and Tripels, beers that are generally between 7 and 12% alcohol by volume, were no direct substitute for genever, but much stronger than most beers. At the end of the First World War, under the new regime of alcohol restriction, the per capita consumption of liquor significantly declined.
What historical death records show
Figure 4: Alcoholism's share of Belgian deaths has fluctuated sharply over nearly 140 years
The vertical line marks changes in the data sources. Source: STATBEL; IHME – Global Burden of Disease; State Archives Brussels, Mouvement de la population; calculations by the author.
Newly digitised death records let us trace alcoholism deaths in Belgium back to 1886. They were high and rising in the late 19th and early 20th century, then dropped sharply around the First World War, during which records are unavailable (Figure 4). This drop stands out even more given how fast alcoholism deaths had been rising in the decades before. The Vandervelde Law likely helped drive the turnaround.
Modern measurement: alcohol-attributable mortality
Figure 5: In 2021, alcohol was behind 3,6% of all deaths in Belgium, with cancer accounting for the largest share
Source: Sciensano – BeBOD; calculations by the author.
Today, we understand much more about how alcohol affects health. Over 200 diseases and injuries have been linked to it. Some, like acute alcohol poisoning or alcoholic cirrhosis of the liver, are caused by alcohol alone. In many other cases, alcohol is one contributing factor among several, rather than the sole cause.
This matters for how we read the historical records, too. Belgian death registers from the 19th-century captured only a narrow slice of alcohol’s true toll — likely no more than 1 death in 10.
Nowadays in Belgium, most alcohol-attributable deaths are due to cancer. This makes sense, as alcohol is a well-established cause of several cancers, including those of the mouth, liver, and bowels. Deaths officially recorded as due to alcohol use disorders — the red bar in Figure 5 — are only a small part of the total, confirming that official records capture only a fraction of alcohol’s true impact. Brussels and Wallonia have slightly higher alcohol-attributable mortality than Flanders.
Inequality in alcoholism and alcohol-attributable mortality
Figure 6: In 1901, repeat offenders were consistently more likely than first offenders to have an alcohol link across all offense categories
Source: Statistique Judiciaire de la Belgique, 1901; calculations by the author.
Several things likely explain this. Among poorer people, many do not drink at all, but those who do are more likely to drink heavily and concentrated in few occasions. Richer people, meanwhile, tend to eat better, exercise more, smoke less, and have easier access to healthcare, all of which may soften alcohol’s harm to the body.
The idea that alcohol might have a different effect on different groups in society is not new. Already in 1886, the Commission de Travail was set up by the Belgian parliament to look into the lives of the working class, and it paid close attention to alcohol use. Drinking was seen as a moral failing, mostly blamed on factory and manual workers. Statistics on drinking and bars were often published alongside figures on vagrants, mendicants, the “mentally insane”, and criminals. Figure 6 shows the share of male convicts whose offense was linked to alcohol — meaning they had acted while drunk, had at least one earlier conviction for drunkenness, or both. Repeat offenders were consistently more likely than first-time offenders to have this alcohol link, no matter the type of crime, showing a clear association between alcohol and criminality.
Per capita liquor consumption, the number of drink shops, hospital admissions for alcohol-induced insanity, and the population of the Colonies de bien-faisance all show high values before the First World War and lower values from 1919 onward. Whether this reflects the effect of legislation, the disruptions of the war itself, or other concurrent changes, is difficult to say. Yet modern evidence confirms that restrictions on alcohol availability can have substantial and long-lasting effects on both consumption and mortality.
Figure 8: Hospital admissions for alcohol-induced insanity, and the population of the Colonies de bien-faisance
Source: Racine 1930; calculations by the author.
Writing in 1930, Aimée Racine, a researcher at the Solvay Institute of Sociology, offered a fervent defence of Belgium’s anti-liquor legislation. She reported on the number of alcohol-selling establishments, recorded cases of alcohol-induced insanity in Belgian hospitals, and the population of the Colonies de bien-faisance, concluding that restrictive legislation was ‘undoubtedly responsible for the progress of temperance in Belgium.’ The figures below (Figure 7 and 8) reproduce her data.
Figure 7: Per capita liquor consumption and the number of drink shops
Source: Racine 1930; calculations by the author.
Figure 9: Deaths due to alcoholism represented an increasing percentage of deaths before WWI and regional differences were large
Source: State Archives Brussels, Mouvement de la population, 1886-1956; calculations by the author.
Alcohol-attributable mortality also varies from region to region. Areas with more unemployment, more manual workers, and weaker social ties tend to have higher rates, while cities tend to do better. Regional disparities in alcohol-attributable mortality and drinking patterns are observed in modern Belgium as well. Historical analyses remain scarce although there is evidence suggesting regional differences in drinking and dietary habits.
Click the names of the provinces in the legend to in- or exclude them from the graph.
Figure 10: Geographical differences in alcoholism mortality are also visible in the maps
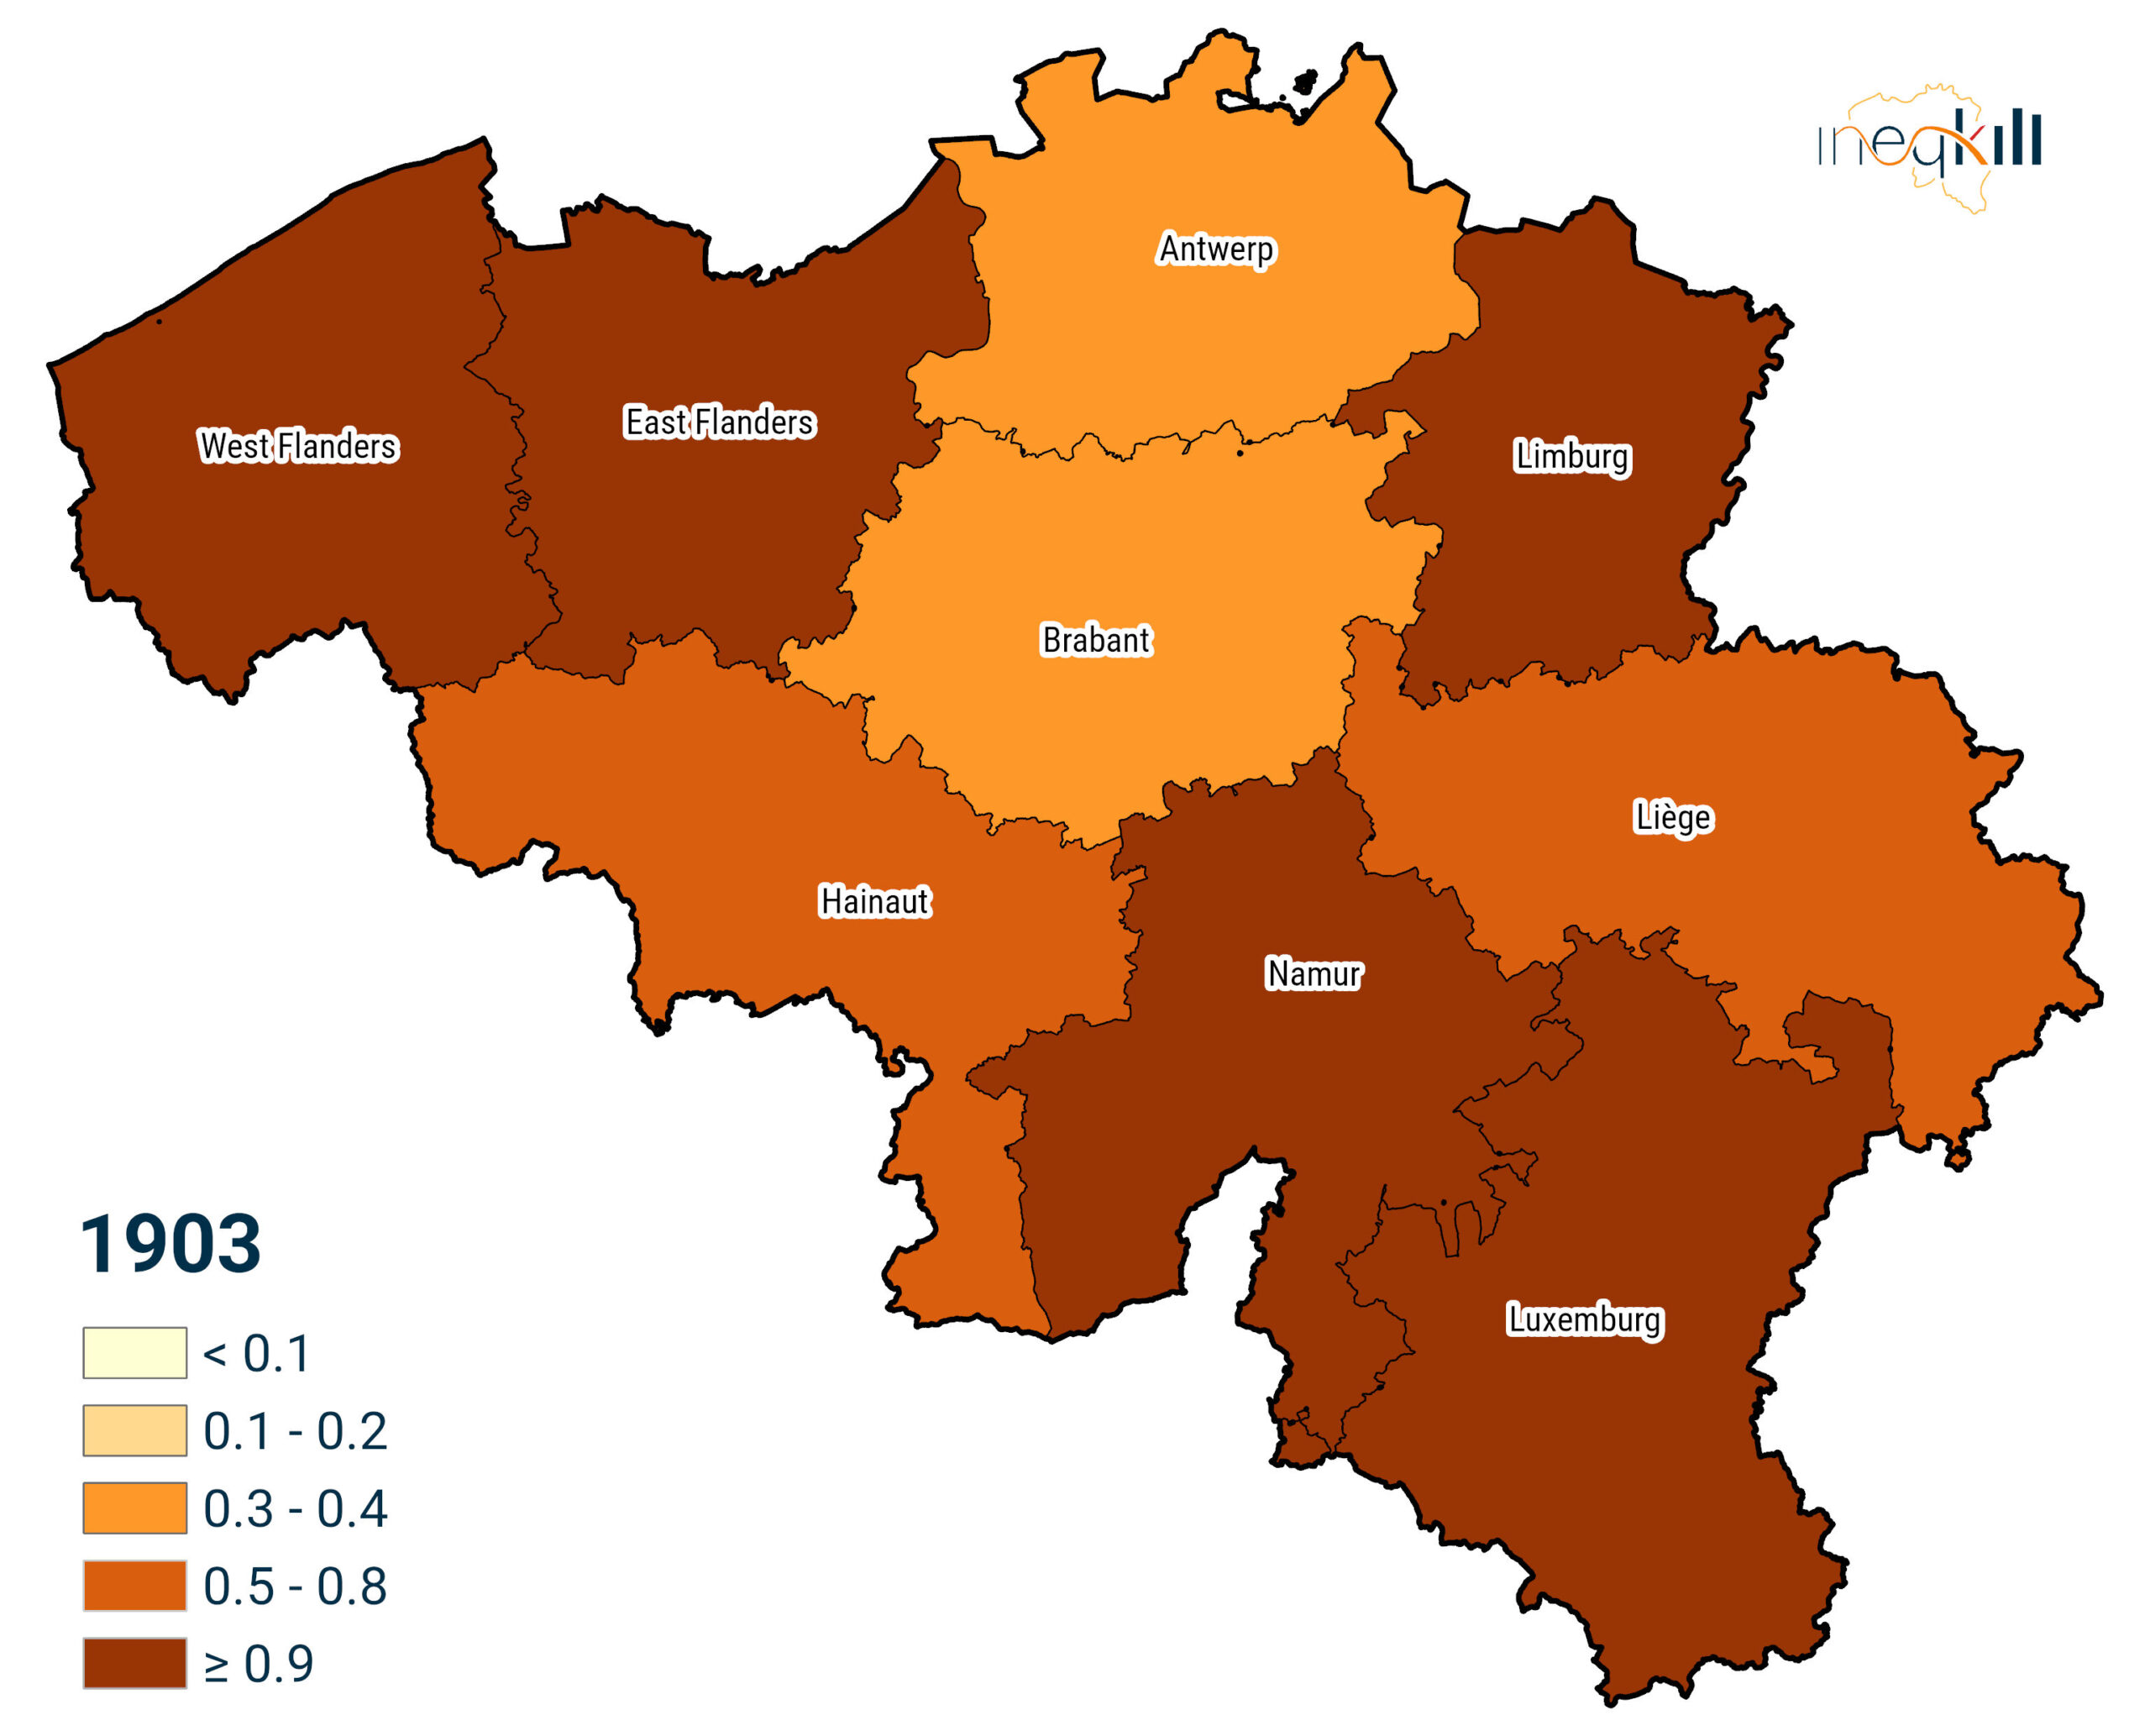
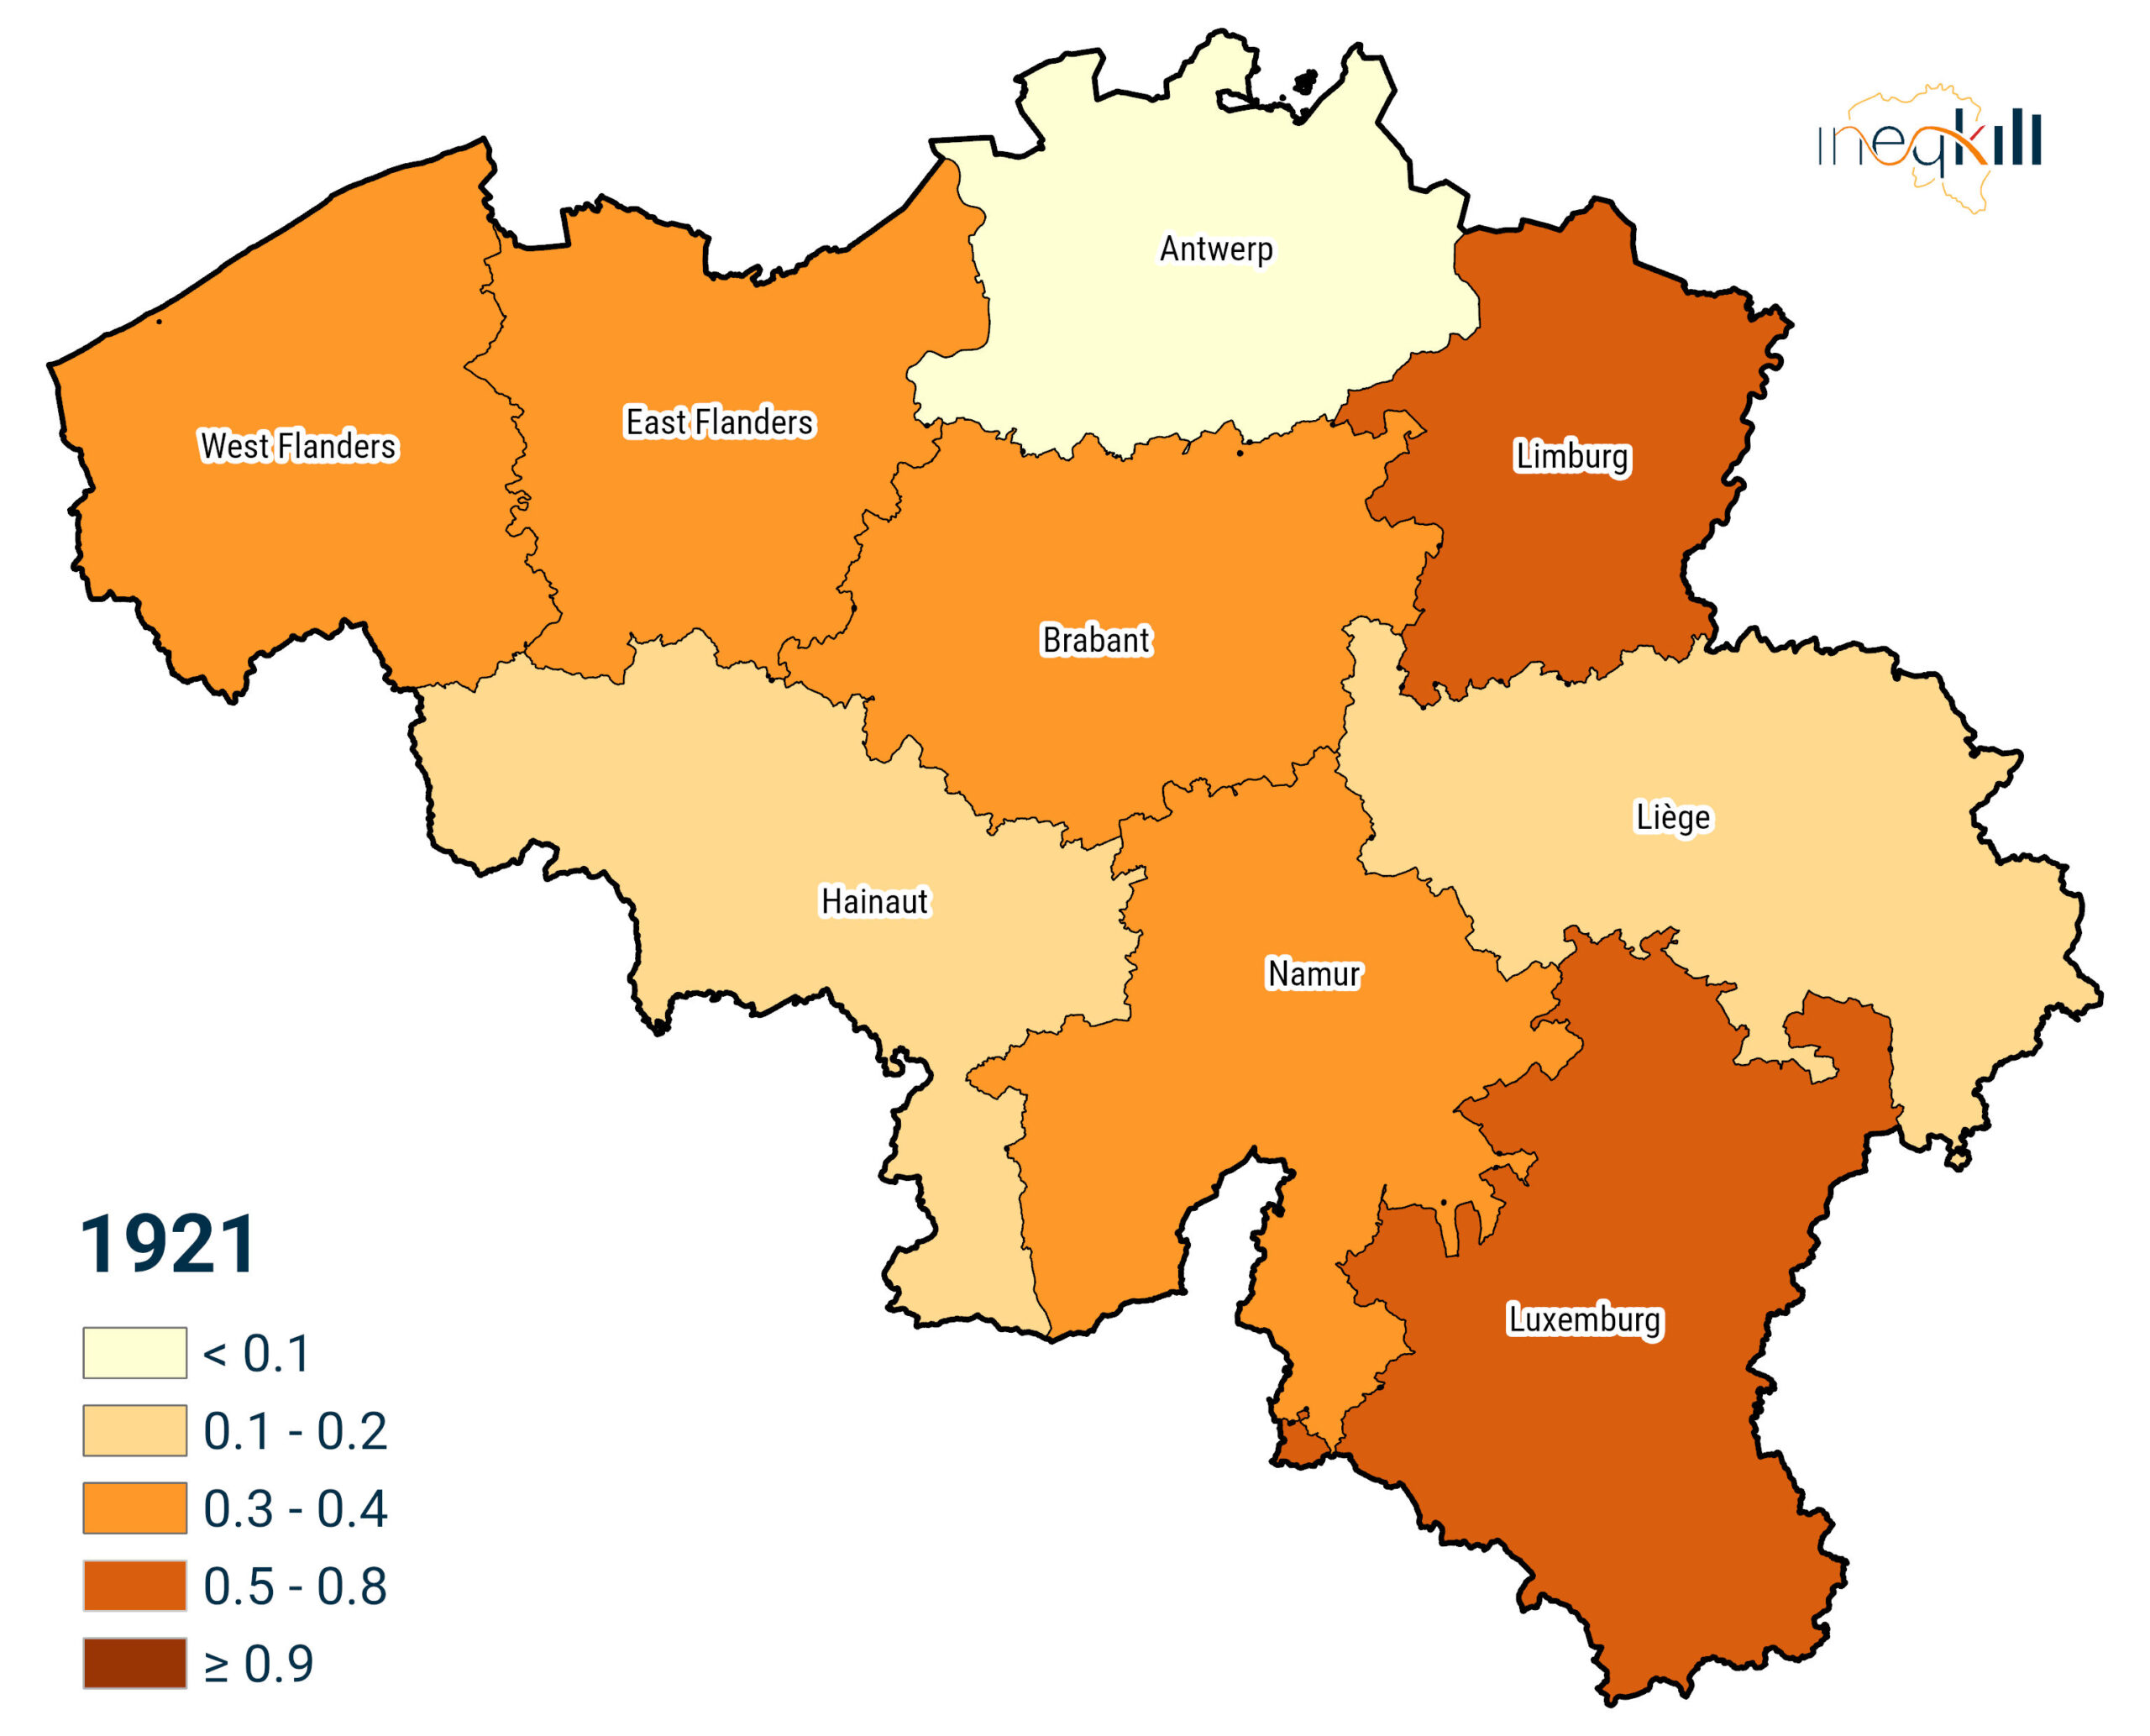
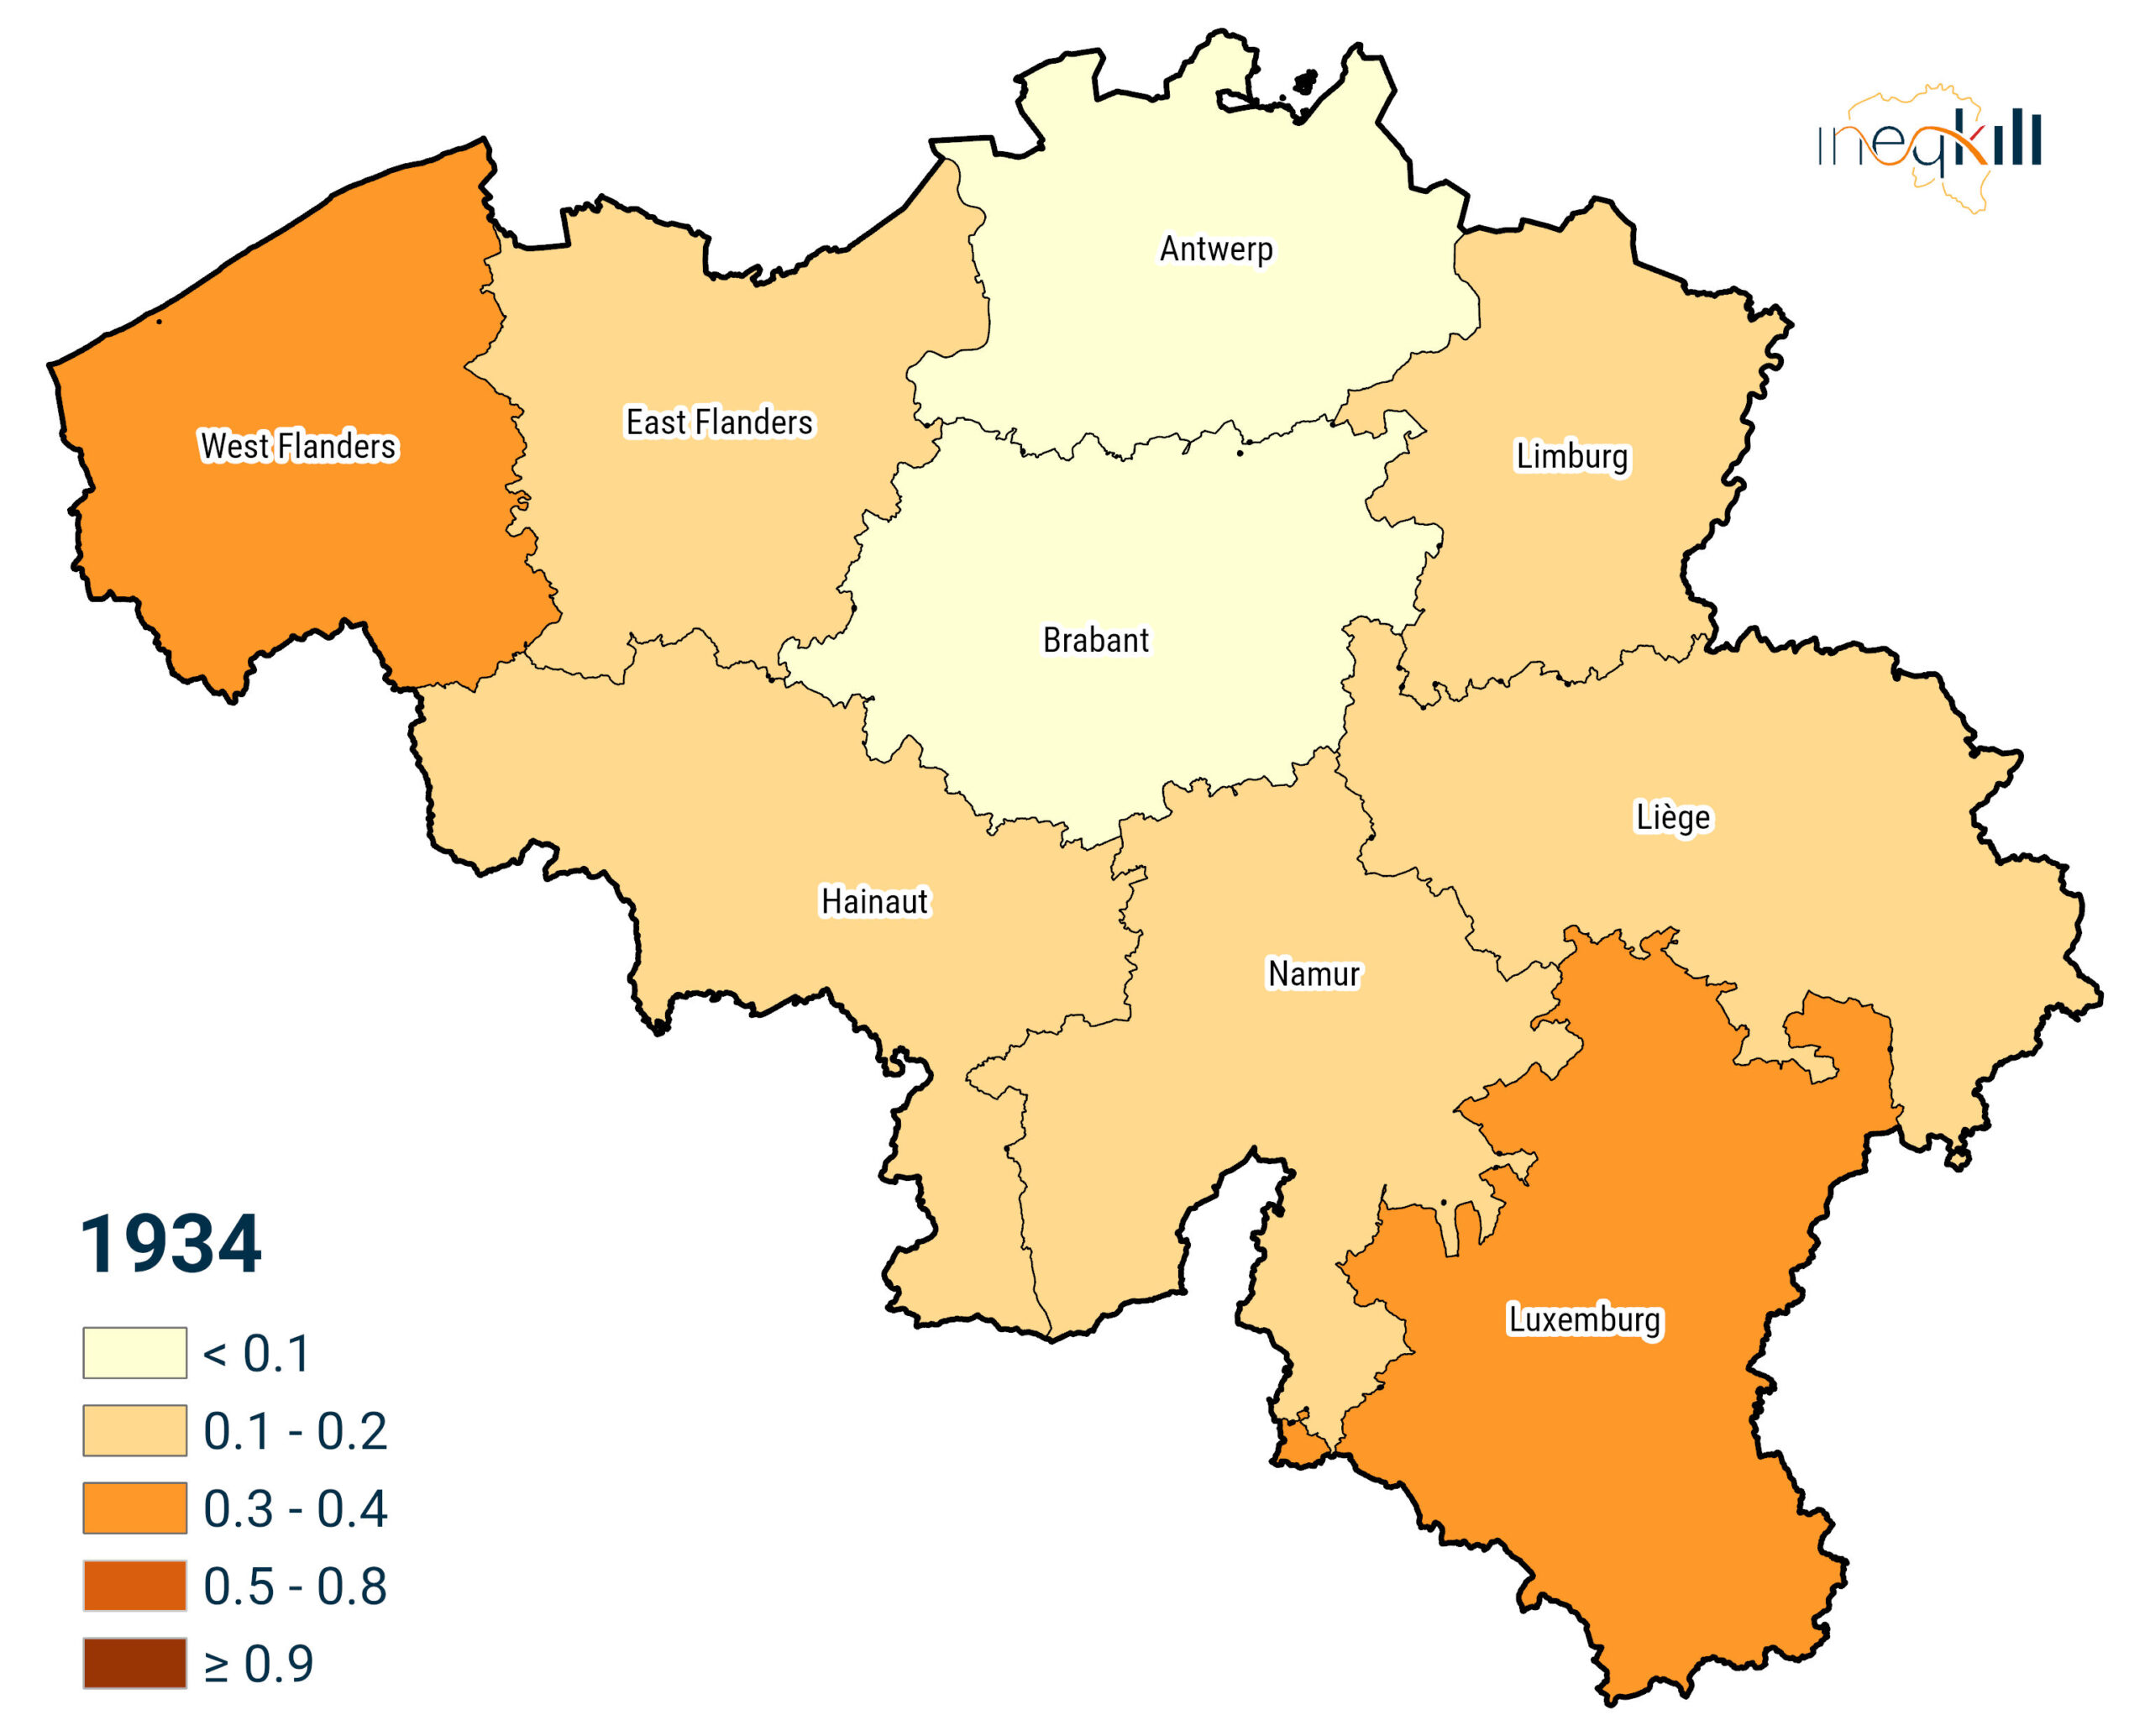
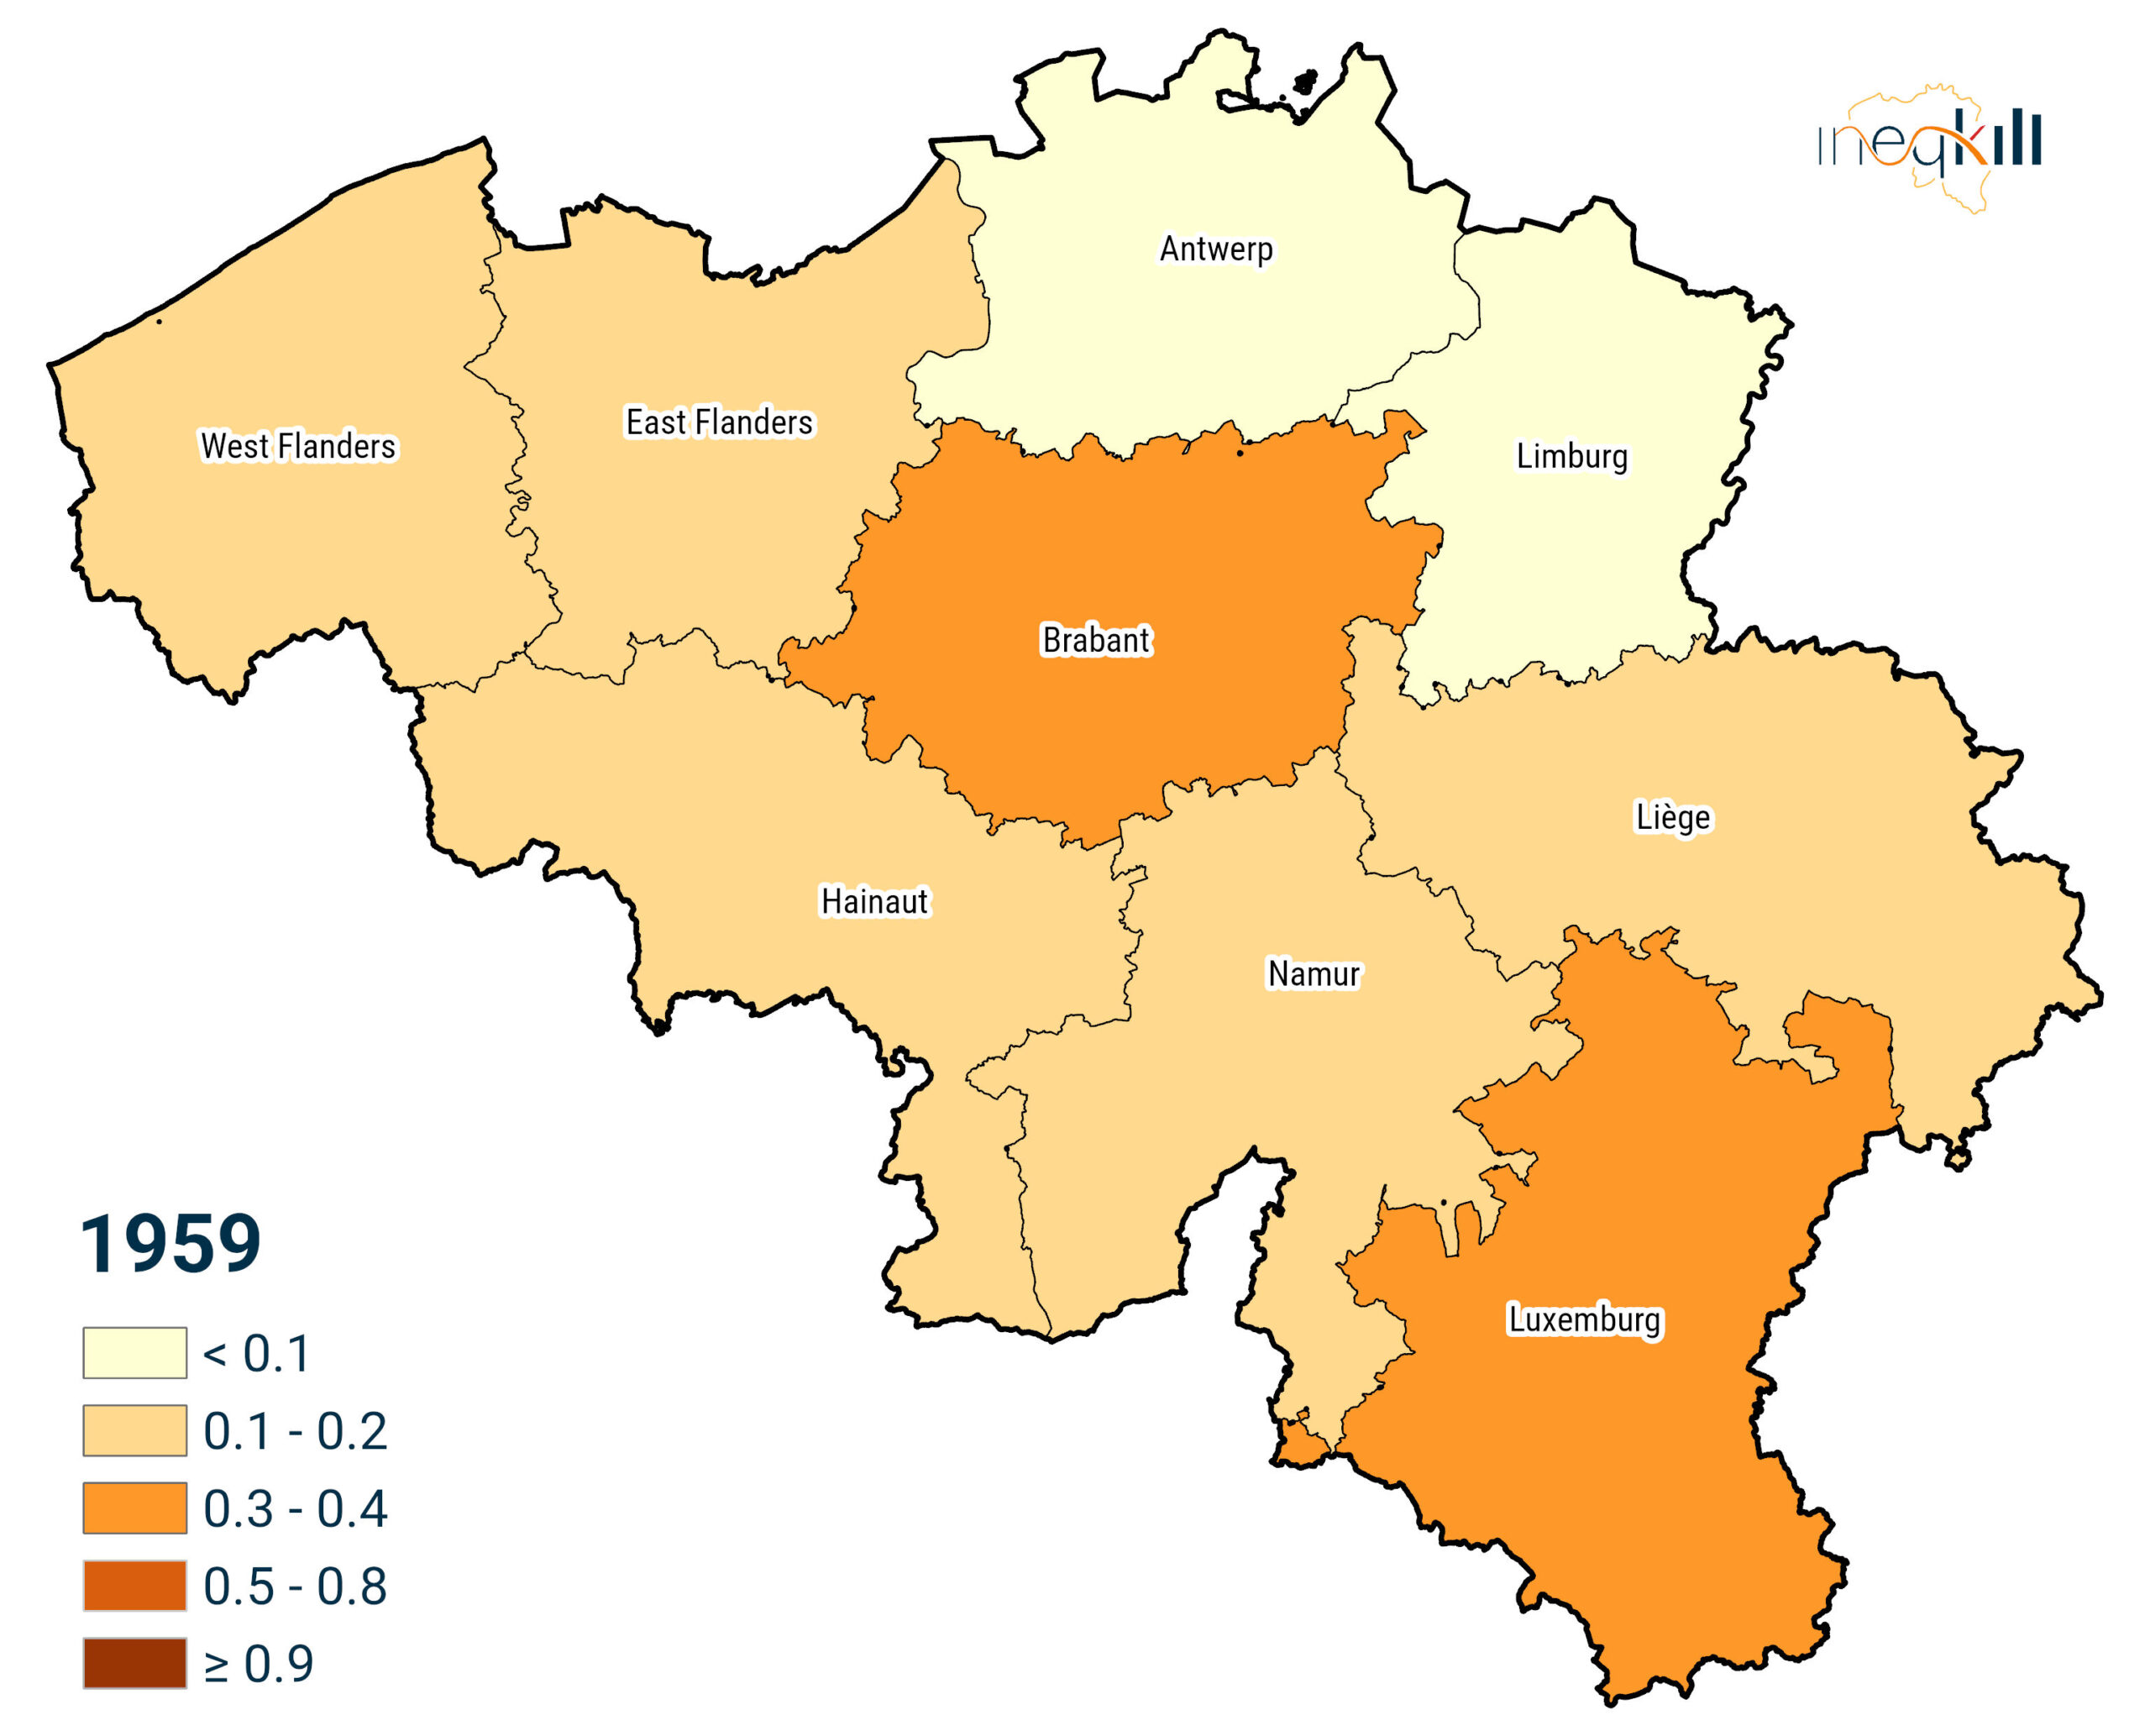
Source: State Archives Brussels, Mouvement de la population, 1903-1959; calculations by the author.
Gender gaps in mortality due to alcoholism are striking and persistent (see Figure 11 below). Men die from alcohol at far higher rates than women, largely because they drink more — a pattern found across virtually every country where data exist, and one that, while narrowing, stretches back at least a century.
What the records miss and why it still matters today
Figure 11: Gender gaps in mortality due to alcoholism are striking and persistent
Source: State Archives Brussels, Mouvement de la population, 1885-1951; calculations by the author.
Historical records that name alcoholism as the cause of death almost certainly capture only a small part of alcohol’s true toll. This shows the limits of official death records. To get a fuller picture, researchers need modern methods that can trace deaths from related causes — such as cirrhosis — back to alcohol.
Even back in the 1880s, people noticed that alcohol hit poorer groups harder, and that gap is still wide today. Beyond how much people drink, things like who they live with, how much money they have, and the conditions they live in likely shaped and still shape how much harm that drinking causes.
The 19th-century mortality surge was fuelled by cheap, widely available spirits, and the response — legislation, civic mobilisation, public pressure — had lasting effects. Today, cheap alcohol is as accessible as ever, and the links between price, availability, and harm remain just as relevant.
Read more
- Blomgren, J., Martikainen, P., Mäkelä, P., & Valkonen T. (2004). The effects of regional characteristics on alcohol-related mortality: a register-based multilevel analysis of 1.1 million men. Social Science & Medicine, 58(12), 2523-2535. (1016/j.socscimed.2003.09.027).
- Mackenbach, J.P., et al. (2015). Trends in inequalities in premature mortality: a study of 3.2 million deaths in 13 European countries. Journal of Epidemiol Community Health, 69(3), 207-217.
- Racine, A. (1930). Belgium’s anti-liquor law. Current History (1916-1940), 32(4), 703-706.
- Scholliers, P. (2008). Food culture in Belgium. London: Greenwood Press.
- Vleugels, A. (2015), Narratives of drunkenness: Belgium, 1830-1914. London: Routledge.
- World Health Organization. (2018). Global status report on alcohol and health 2018.Geneva: World Health Organization.
Data sources
- Annuaire statistique de la Belgique, 1913.
- Institute for Health Metrics and Evaluation (IHME), Global Burden of Disease.
- Sciensano, BeBOD – Belgian National Burden of disease: Risk factor attributable burden: Alcohol attributable burden, Health Status Report, 30 January 2025.
- STATBEL, Databases on mortality.
- State Archives Brussels, Mouvement de la population et de l’état civil, 1886-1976.
- Statistique judiciaire de la Belgique, 1901.